2. 网络构建与模块识别
2.0 对上一期博客的补充与说明
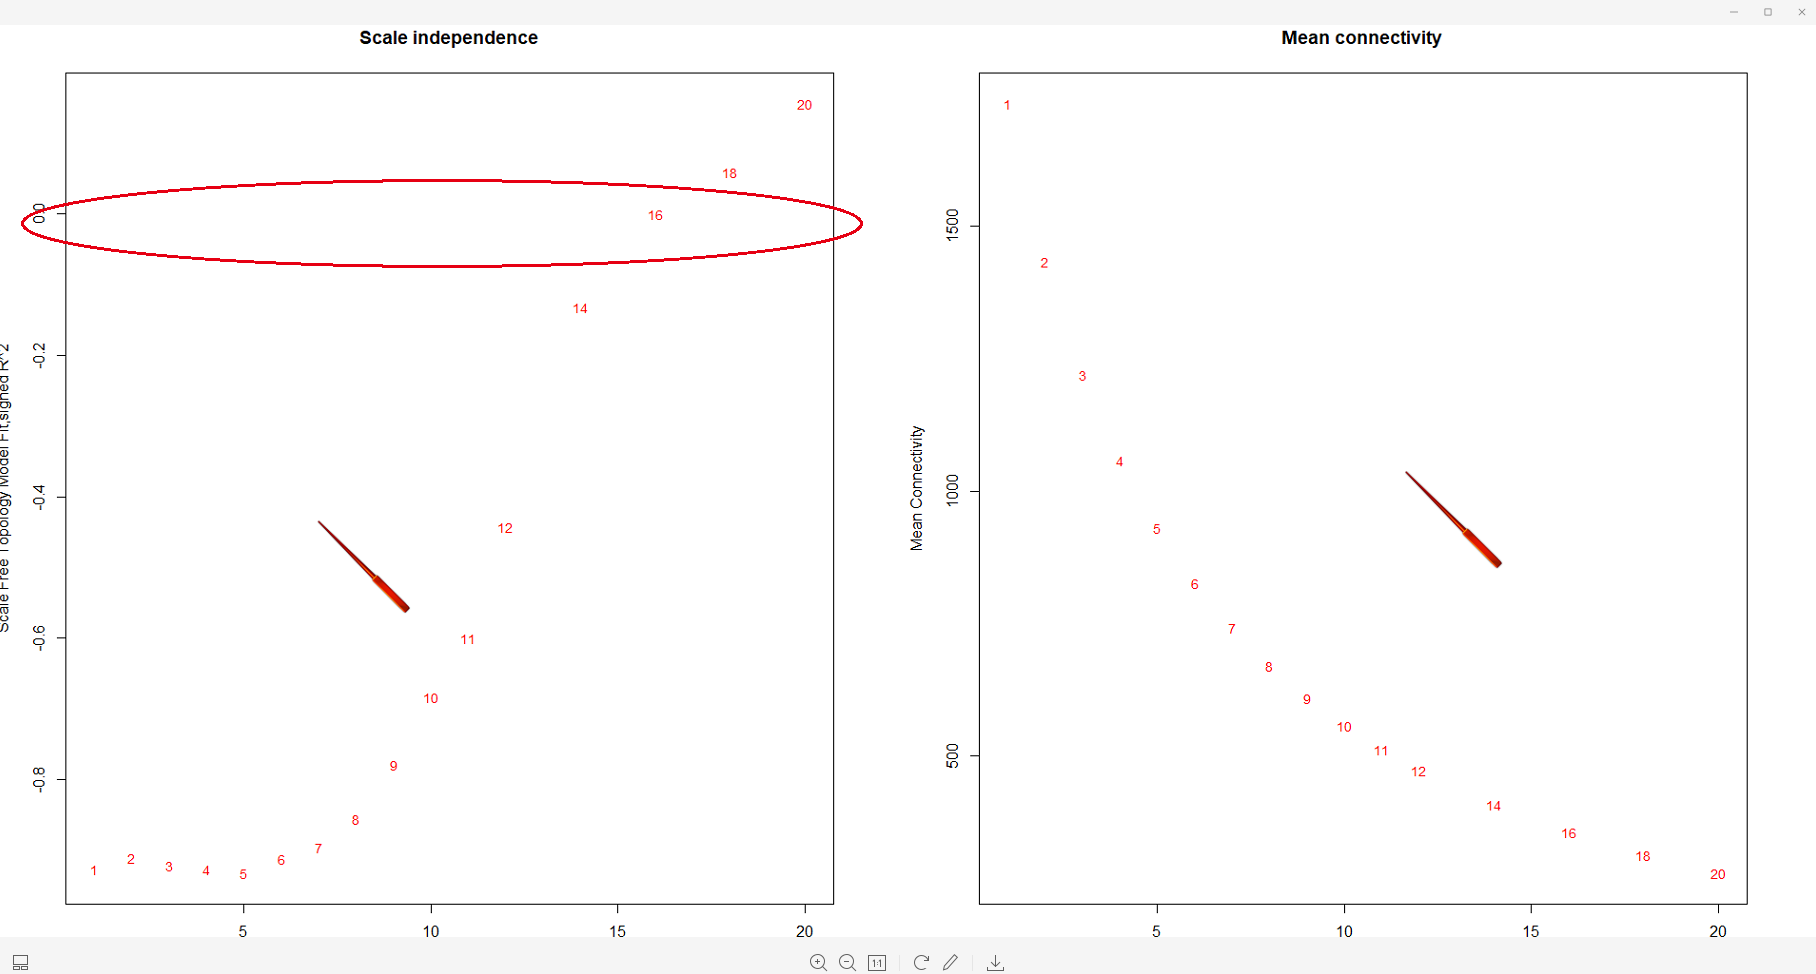
上一期博客中,我们使用的数据大约1600条,但是当我们筛选 soft threshold 的时候出现了歪瓜裂枣!如下:
全部基因:
约600个基因:
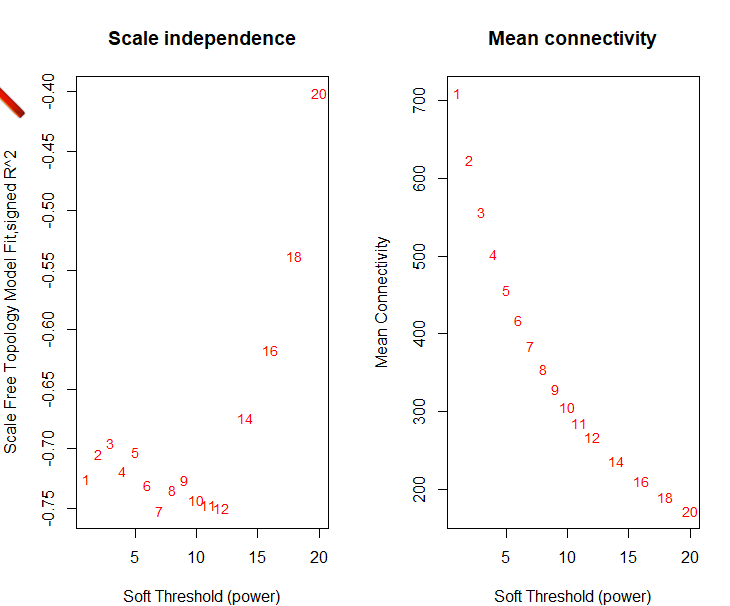
还是一个样子,所以这样的数据集是做不出来的,其中的原因我没去深究,我想可能是数据全是差异显著的数据,破坏了某种平衡吧!所以我后面用了所有的表达数据,维度如下(数据格式,样本名字之类的都没有变化,所以原始数据我就不贴图了:

还是贴个图吧,数据如下

上一期我是手动用excel去重,当我今天打开这个重复的时候,一千多行,这就没法手动了,太多了,我们今天来个便捷的去重,先做到后面再说!代码如下:
library(tidyverse) #需要先加载这个包,去重也可以用R语言的基础函数duplicate,但是我习惯用其他替代包
dat <- dat %>% dplyr::distinct(.,SYMBOL,.keep_all = TRUE)
这是去重后的维度,少了一千多个!一般情况,如果我们用的转录本水平的定量,如果换成基因名肯定会有这样的情况,但是如果用转录本名字的话可以避免这个问题。

如果我们换成转录本去重
library(tidyverse) #需要先加载这个包,去重也可以用R语言的基础函数duplicate,但是我习惯用其他替代包
dat <- dat %>% dplyr::distinct(.,Transcript_id,.keep_all = TRUE)
很明显使用转录本去重损失的信息最少,所以我们还是选择转录本去重!然后重复上一期的内容!最后我选择留下了7024个基因进行WGCNA分析!
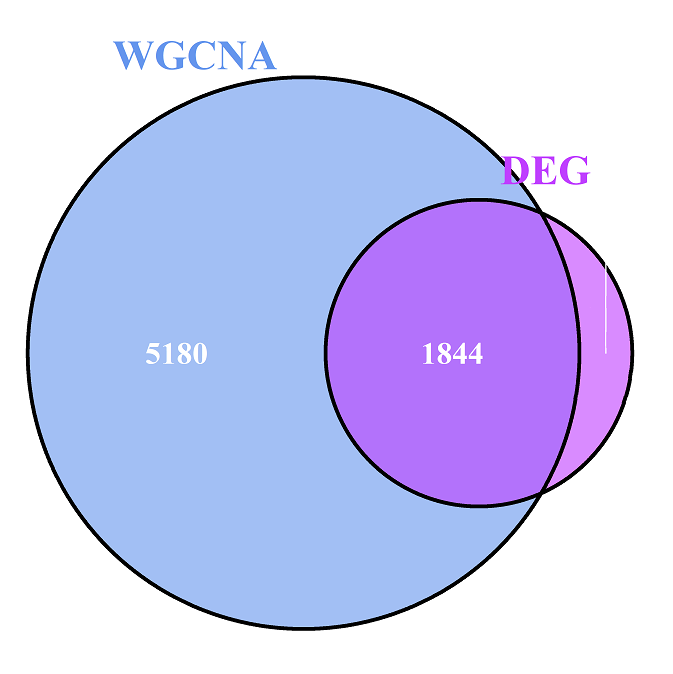
说到这里,我稍微有点好奇我们这7024个基因里面包含了多少差异基因,于是韦恩图就出来了!如下,惊不惊喜意不意外?
2.1 概述
上一篇博文WGCNA分析专栏1-数据准备我们介绍如何准备用于WGCNA的基因表达谱数据及表型(临床)数据,得到满足条件的数据后,我们将进行后续的分析。
面对上述满足条件的成百上千个基因,那我们应该如何进行分析呢?举个简单的例子,假设广场上有1000人,现在需要你找出两名模特,这两名模特需要代表这1000人的水平,那么你会怎么选?很简单,如果是我,我首先会把这1000人按照性别分为两组,一组男人,一组女人!然后按照模特的需求,从体重,身高,长相,三维、肌肉等多个条件进行限定筛选,最后会得出几个人,那么继续再增加条件筛选,筛选出最优的两个,这是一种知道某些条件从而筛选的一种方法,**专业名词我忘了叫什么,好像叫做分类**,可以去看我的基于R语言的样本聚类-1,欢迎补充!还有的方法就是比如常用的降维方法——主成分分析。
言归正传,我们继续搞上面的那一堆基因,我们需要根据某些特征(表达特征)对基因进行计算、归类,找到相似的gene subset,然后进一步研究gene subset的具体功能,现在我们开始这一期的内容!
2.2 自动网络构建及模块识别
首先,老样子,不论三七二十一,为了保住狗命,我们先上下面这个代码 块:
workingDir = ".";
setwd(workingDir);
library(WGCNA)
options(stringsAsFactors = FALSE);
enableWGCNAThreads() # 可用核心数
导入数据:
lnames = load(file = "../result/1.Deodunum-01-dataInput.RData")
lnames
2.2.1 软阈值的选择:网络拓扑结构分析
想要构建加权基因共表达网络,我们首先应该确定一个软阈值β(power value),将共表达相似度提高到该阈值来计算邻接度,该软阈值的计算是通过近似无标度拓扑(有点鸟语了,上英语the criterion of approximate scale-free topology)标准进行。
上代码,选阈值
powers = c(seq(1,11,by=1), seq(from = 12, to=20, by=2)) # seq里面的数字根据自己的数据来更改

sft = pickSoftThreshold(datExpr, powerVector = powers, verbose = 5)

tiff(filename = "../result/3.Scale independence.tiff",
     width = 6,height = 4,units = "in",
     pointsize = 5,res = 300)
par(mfrow = c(1,2)) # 设置画图面板,1行2列
cex1 = 0.9 # 字体大小
plot(sft$fitIndices[,1], -sign(sft$fitIndices[,3])*sft$fitIndices[,2],
     xlab="Soft Threshold (power)",ylab="Scale Free Topology Model Fit,signed R^2",type="n",
     main = paste("Scale independence"))

text(sft$fitIndices[,1], -sign(sft$fitIndices[,3])*sft$fitIndices[,2],
     labels=powers,cex=cex1,col="red");

abline(h=0.80,col="black",lty=4,lwd=1) #h值的选择是准确性的选择,即R^2,其他参数不会就改变值看图片的变化
# 平均连接度
plot(sft$fitIndices[,1], sft$fitIndices[,5],
     xlab="Soft Threshold (power)",ylab="Mean Connectivity", type="n",
     main = paste("Mean connectivity"))
text(sft$fitIndices[,1], sft$fitIndices[,5], labels=powers, cex=cex1,col="red")

dev.off()
结果如下图:
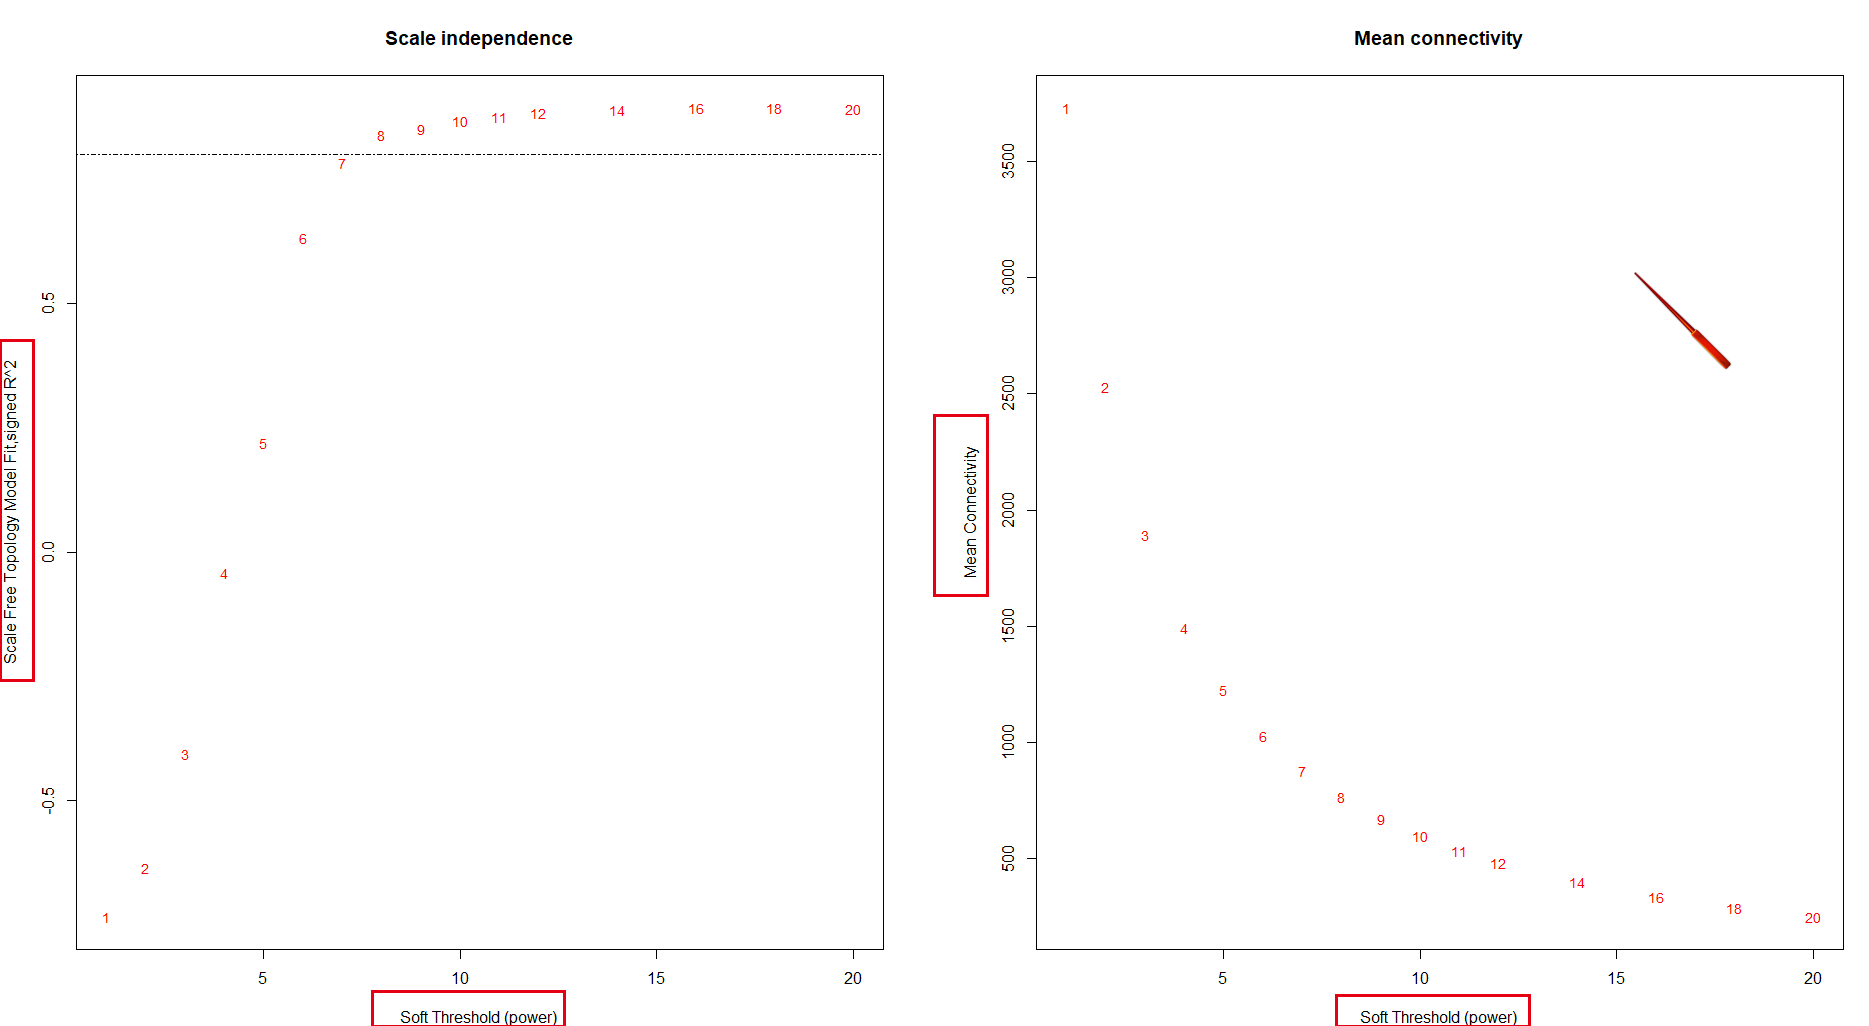
图1:不同软阈值power下的网络拓扑结构分析。左图显示了无标度拟合指数(y轴)与软阈值power(x轴)的关系。右图显示平均连通性(度数,y轴)与软阈值power(x轴)的关系。
当选择R^2(无标拓扑适合指数) >0.8时,power=8,这里有一个小知识,就是软阈值的选择问题,第一次跨过划线的那个值就是power值,并且 power ≤ 13才行,大于13的表明数据很垃圾,得慎重考虑;同时6,7,8这个范围较好!
2.2.2 一步法网络模块构建与识别
先贴上这么一段话,看完2.2.2、2.2.3和2.2.4再来看一遍,会有很好的效果哟:
We present three different ways of constructing a network and identifying modules: a. Using a convenient 1-step network construction and module detection function, suitable for users wishing to arrive at the result with minimum effort; b. Step-by-step network construction and module detection for users who would like to experiment with customized/alternate methods; c. An automatic block-wise network construction and module detection method for users who wish to analyze data sets too large to be analyzed all in one. In this tutorial section, we illustrate the step-by-step network construction and module detection.
一步法直接调用函数生成基因网络
power=8 # 根据上面的计算,得出的软阈值,我单独提出来用是因为后面很多地方我都用这个常量代替了,就不进行一一输入,这是懒人用法;
minModuleSize=100 # 这个是指定检测模块中包含的技术数目最小值,因为我这里选择了7千左右个基因,是一个比较大的基数,所以我选择最小基因数为100,这里可以根据你的研究目的来确定,不管你选多少,计算的结果都一致,只是呈现出来的你看见不同而已!
net = blockwiseModules(datExpr, power = power,
                       TOMType = "unsigned",
                       minModuleSize = minModuleSize,
                       reassignThreshold = 0,
                       mergeCutHeight = 0.25,
                       numericLabels = TRUE,
                       pamRespectsDendro = FALSE,
                       saveTOMs = TRUE,
                       saveTOMFileBase = "../result/4.QinchuanDeodunumTOM",
                       verbose = 3)
net$colors #查看模块分配
net$MEs # 查看模块eigengenes注意:上述我们选择了7000个基因进行了这一项分析,进行这一步的时候回得到两个文件,这是因为blockwiseModules函数中的maxBlockSize参数默认5000千,所以需要拆分成2个Tom矩阵。Tom矩阵越多,对后续的画图会产生影响,不利于画图。至于这个数值的设定,可以根据计算机配置来计算:
≥ 4GB 8000-10000个 genes
≥ 16GB 20000个 genes
≥ 32GB 30000个genes。
做到这里,模块已经构建完毕,都保存在了对象net中,我们可以用如下代码查看有多少个模块及其size
table(net$colors)
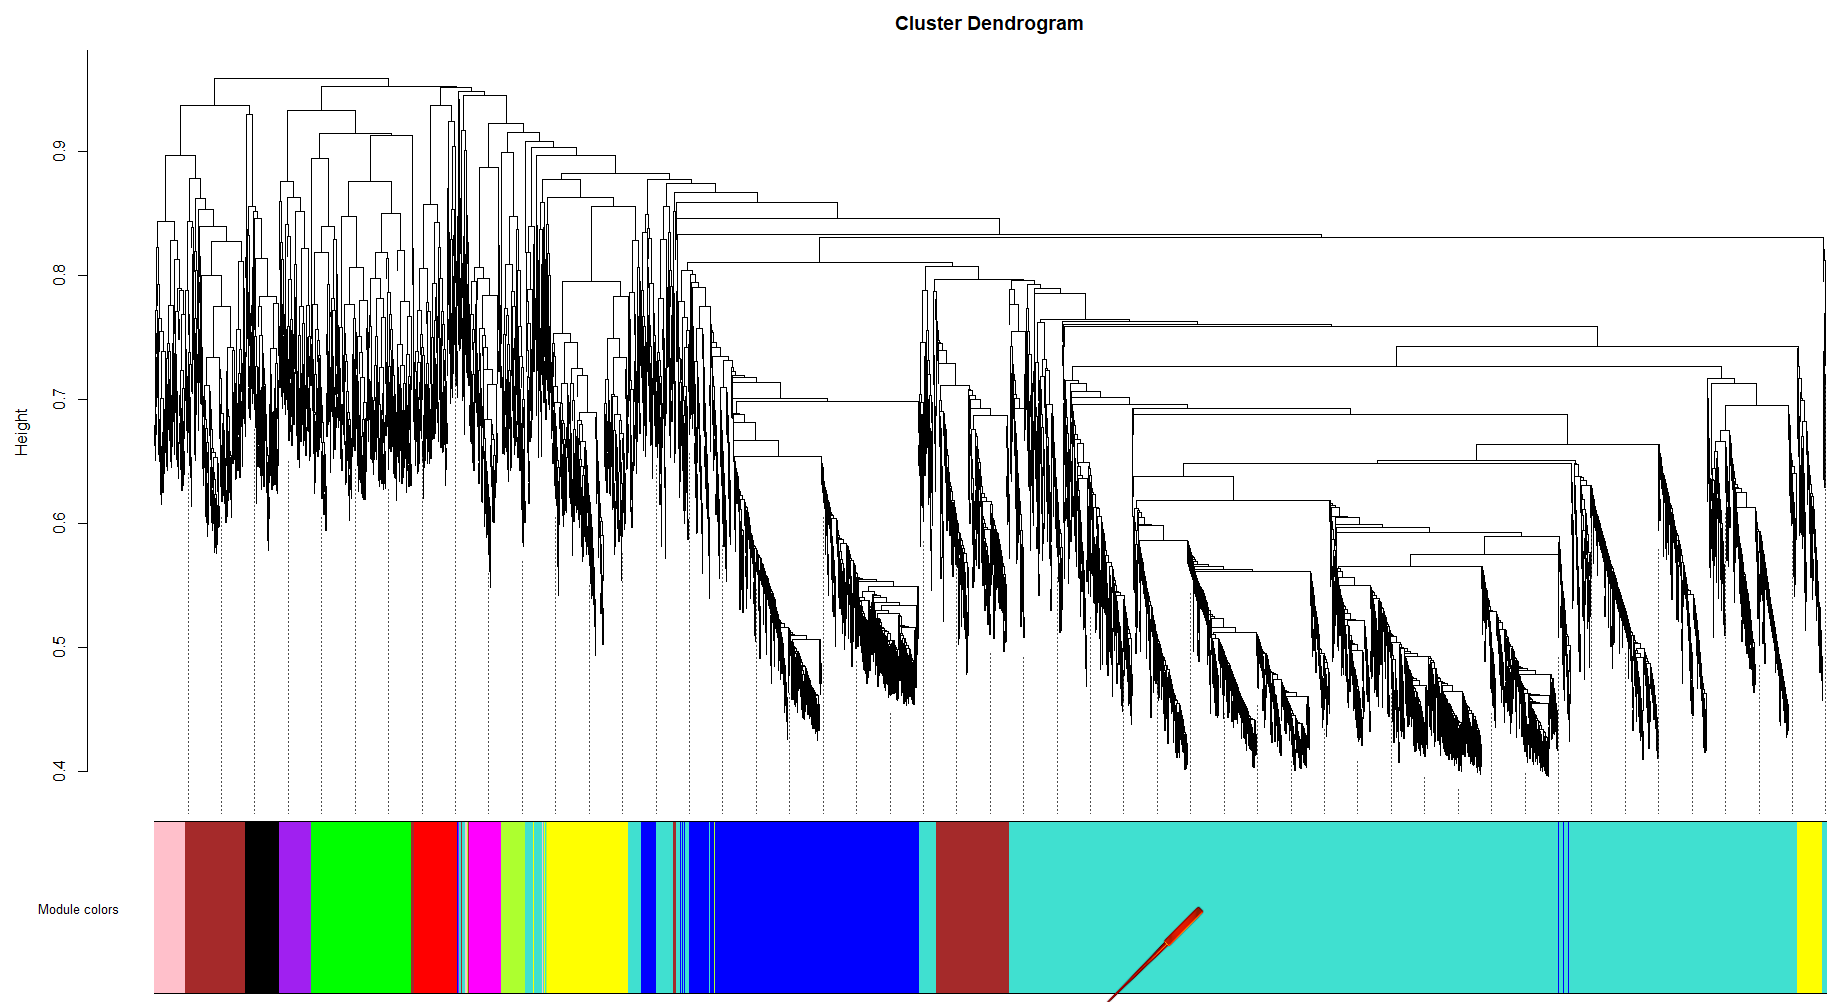
结果显示我们共检测到11个模块,下面是包含的基因数量。“0”下面的“5”是在这11个模块之外的基因数量。
使用如下代码进行模块与基因的关系可视化
mergedColors = labels2colors(net$colors)

tiff(filename = "../result/5.Module colors.tiff",
     width = 4,height = 2,units = "in",
     pointsize = 5,res = 300)
plotDendroAndColors(net$dendrograms[[1]],
                    mergedColors[net$blockGenes[[1]]],
                    "Module colors",
                    dendroLabels = FALSE,
                    hang = 0.03,
                    addGuide = TRUE,
                    guideHang = 0.05,
                    )

dev.off()
结果如下:
保存数据备于后续分析
moduleLabels = net$colors
moduleColors = labels2colors(net$colors)
MEs = net$MEs;
geneTree = net$dendrograms[[1]];
save(MEs, moduleLabels, moduleColors, geneTree,
     file = "../result/6.QinchuanDeodunum-02-networkConstruction-auto.RData")

geneTree$labels
2.2.3 逐步法网络模块构建与识别
写到这里,其实上面已经构建完成了模块,对于一般的使用者或者要求不高的人来说,往下做不做都没多大必要,但是为了教程的完整性,我们还是继续做下去。
首先,还是像2.2.2那样,清空环境变量,导入数据等等婆婆妈妈!
workingDir = ".";
setwd(workingDir);
library(WGCNA)
options(stringsAsFactors = FALSE);
enableWGCNAThreads() # 可用核心数
# load the data
lnames = load(file = "../result/1.Deodunum-01-dataInput.RData")
lnames根据2.2.2的计算,我们得出power = 8 值和 minModuleSize = 100,那么我们后续的工作也直接利用它即可!
2.2.3.1 计算相邻矩阵
power = 8;
minModuleSize = 100;
softPower = power;
adjacency = adjacency(datExpr, power = softPower); # 计算模块邻接关系
2.2.3.2 计算拓扑重叠矩阵
影响相邻矩阵的因素较多,比如噪音和非真正关联,需要将邻接矩阵转化为拓扑重叠矩阵以消除这些影响,并同时计算出不相似度。
TOM = TOMsimilarity(adjacency);
dissTOM = 1-TOM
2.2.3.3 利用TOM矩阵对基因进行聚类
利用hclust函数对基因进行层次聚类
geneTree = hclust(as.dist(dissTOM), method = "average");

sizeGrWindow(12,9)

plot(geneTree,
     xlab="",
     sub="",
     main = "Gene clustering on TOM-based dissimilarity",
     labels = FALSE,
     hang = 0.04);
效果如下:
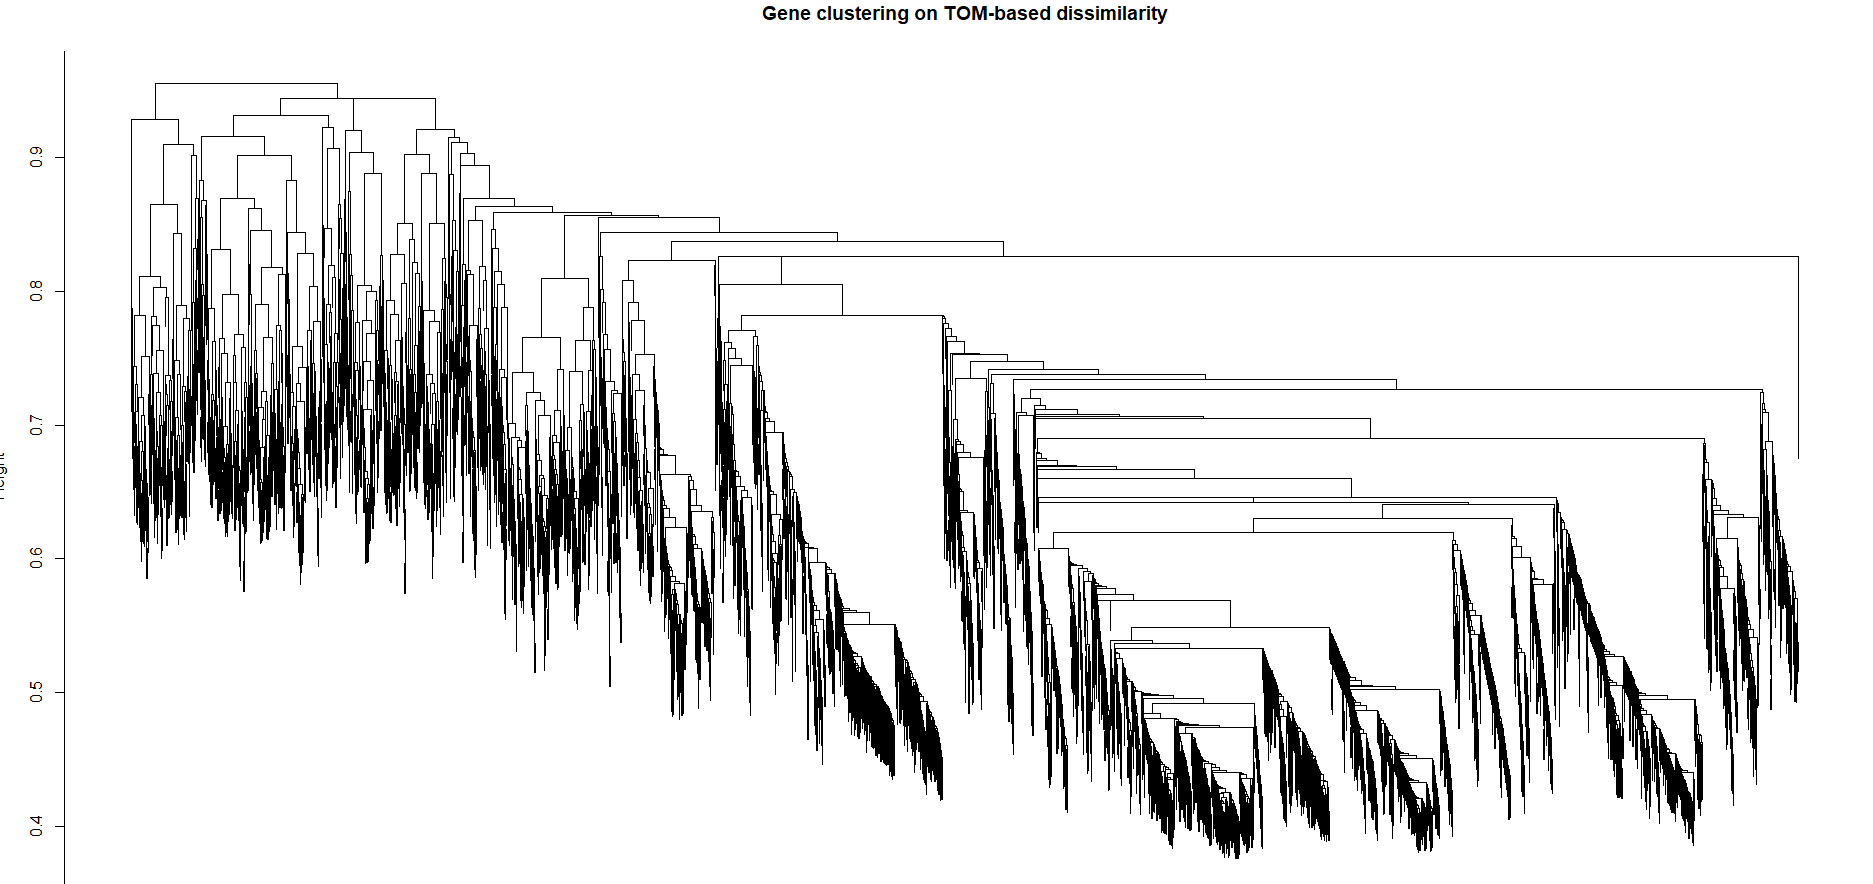
在这个分层聚类的树状图中,一条叶子对应一个基因,并且树枝将相互紧密联系的、高度共表达的基因组合在一起。后面的模块识别也是基于这个聚类进行切割模块。在这里,使用的是动态剪切的方法对模块进行切分(dynamicTreeCut 包)。
执行动态剪切:
dynamicMods = cutreeDynamic(dendro = geneTree,
                            distM = dissTOM,
                            deepSplit = 2,
                            pamRespectsDendro = FALSE,
                            minClusterSize = minModuleSize);
table(dynamicMods)
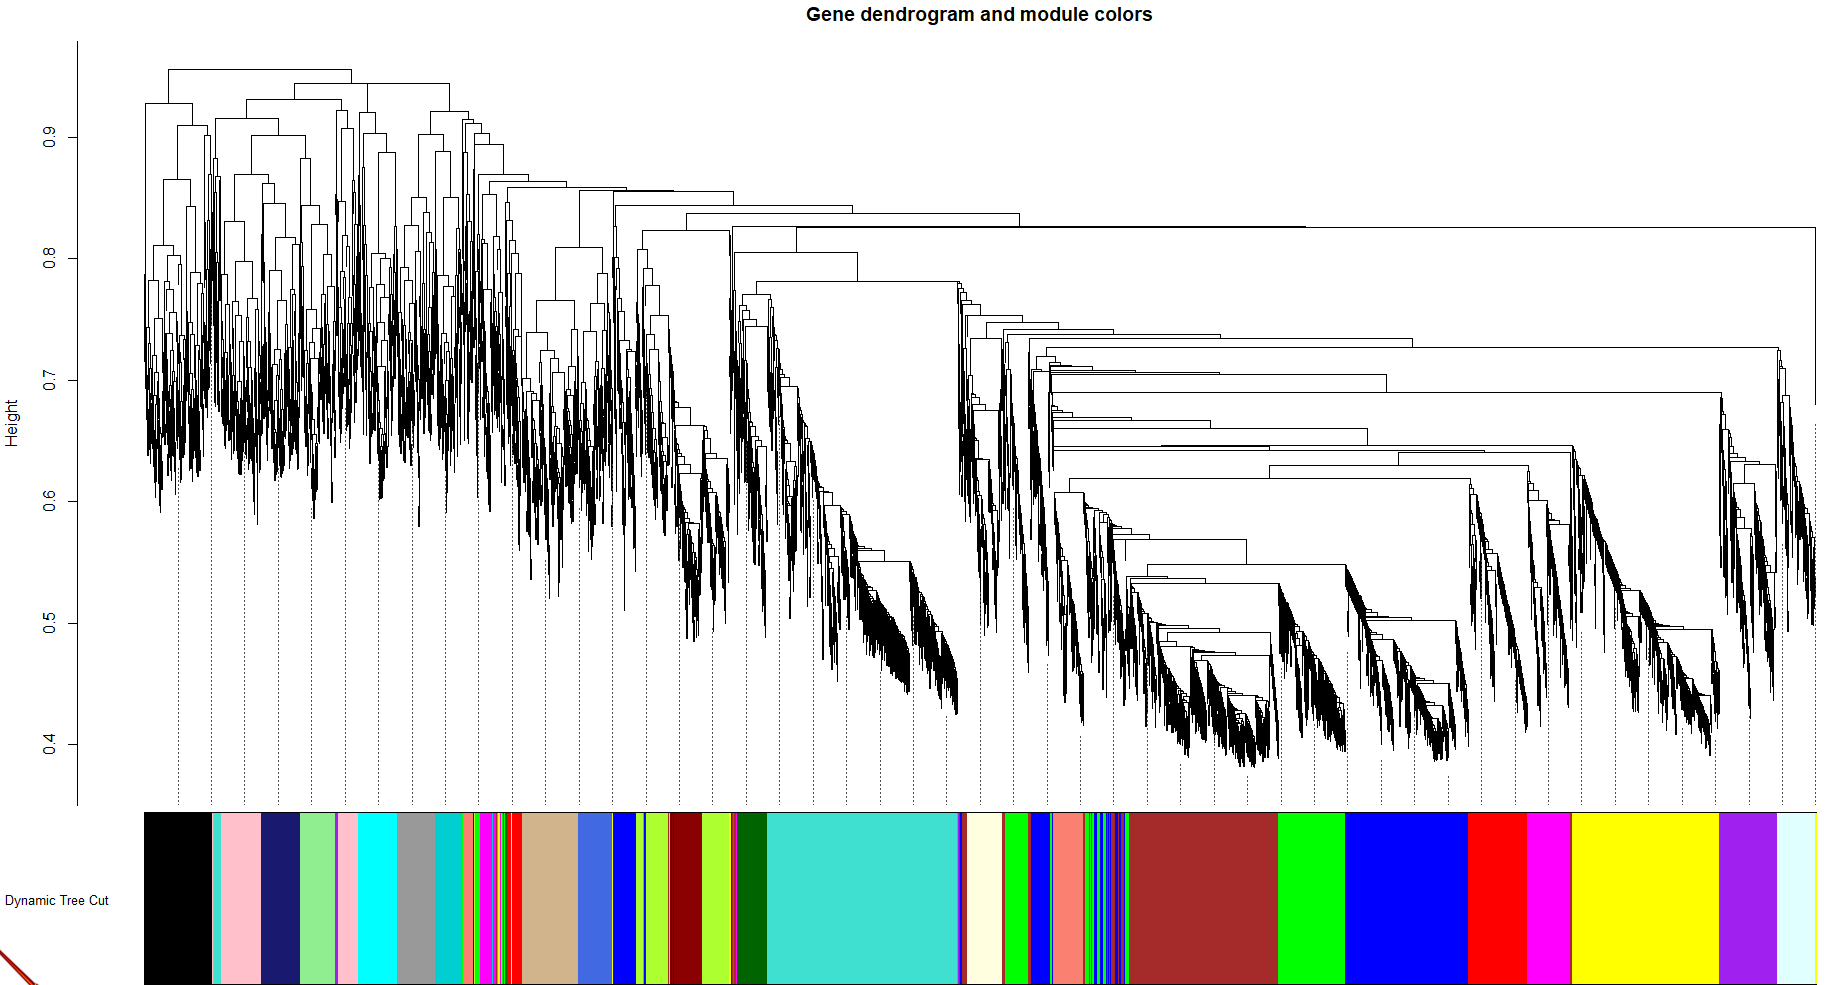
这一步我们可以得到相应的模块,如下图:

接着进行模块分布绘制:
先看一下我们模块的基因分布:加起来就是上述的23个modules
dynamicColors = labels2colors(dynamicMods)
table(dynamicColors)
可视化:
tiff(filename = "../result/12.Gene dendrogram and module colors.tiff",
     width = 4,
     height = 2,
     units = 'in',
     res = 300,
     pointsize = 5)
plotDendroAndColors(geneTree,
                    dynamicColors,
                    "Dynamic Tree Cut",
                    dendroLabels = FALSE,
                    hang = 0.03,
                    addGuide = TRUE,
                    guideHang = 0.05,
                    main = "Gene dendrogram and module colors")
dev.off()
效果如下:
2.2.3.4 合并高度相似的共表达模块
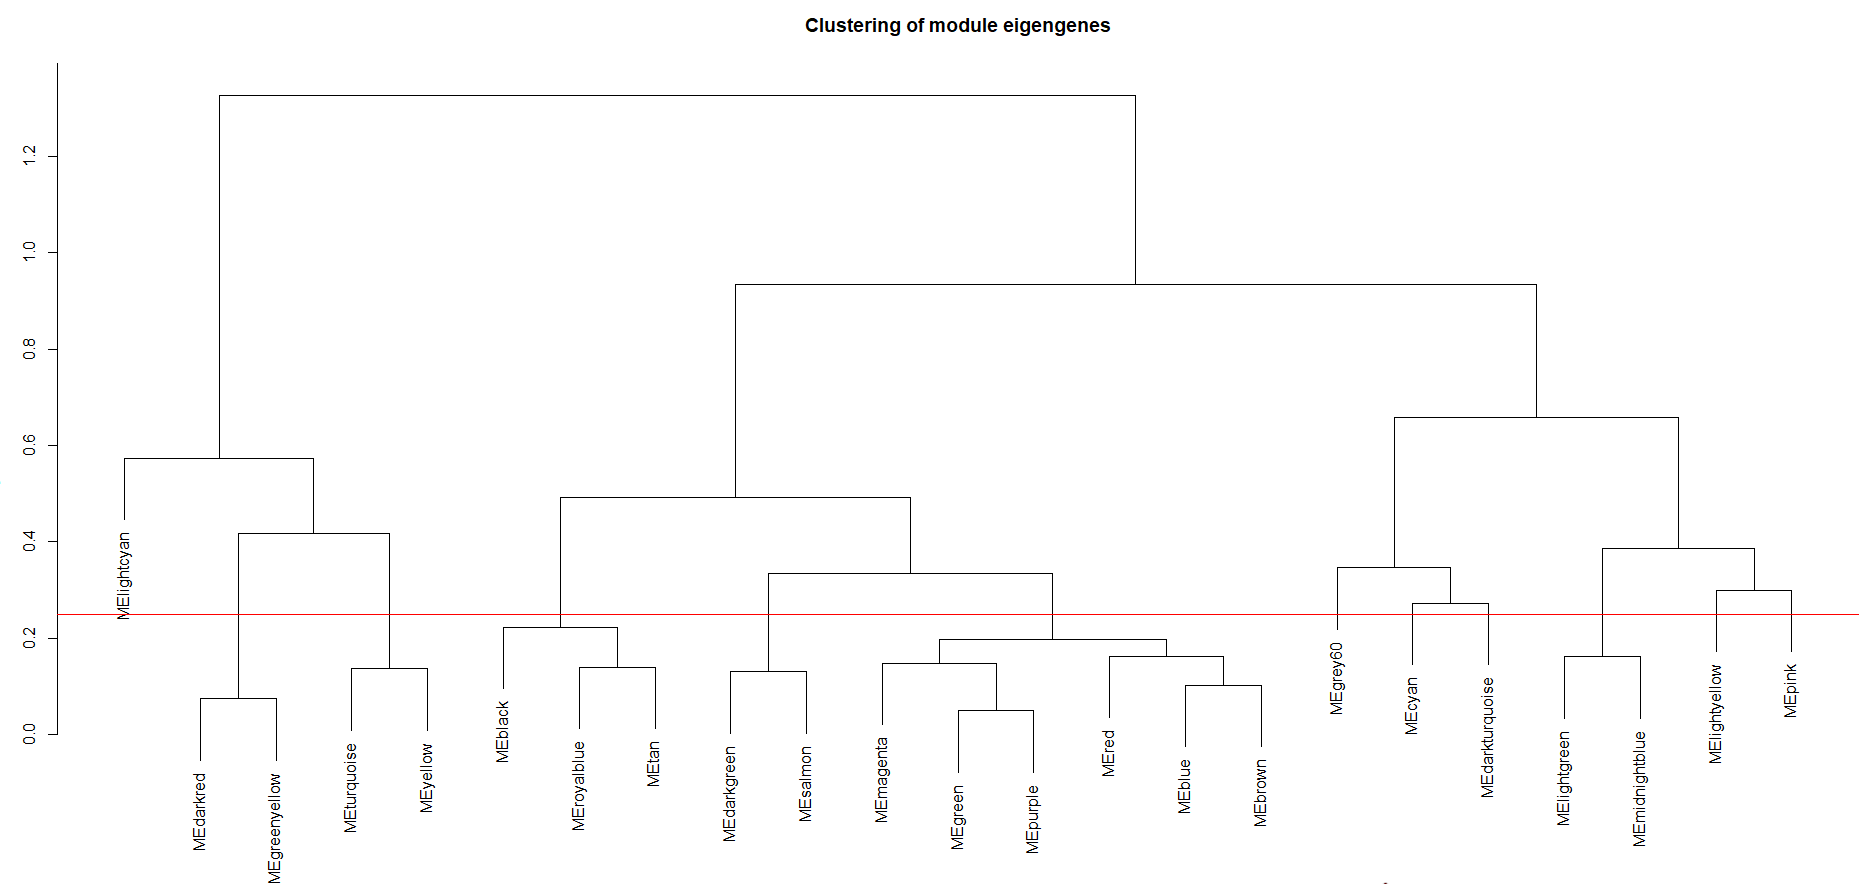
为了量化整个模块的共表达相似性,需要计算它们的eigengenes,并根据它们的相关性对它们进行聚类。
# Calculate eigengenes
MEList = moduleEigengenes(datExpr, colors = dynamicColors)
MEs = MEList$eigengenes
# Calculate dissimilarity of module eigengenes
MEDiss = 1-cor(MEs);
# Cluster module eigengenes
METree = hclust(as.dist(MEDiss), method = "average");
# Plot the result
tiff(filename = "../result/13.clustering of module eigengens.tiff",
     width = 4,
     height = 2,
     units = 'in',
     res = 300,
     pointsize = 5)
plot(METree,
     xlab = "",
     sub = "",
     main = "Clustering of module eigengenes")
dev.off()
效果如下:
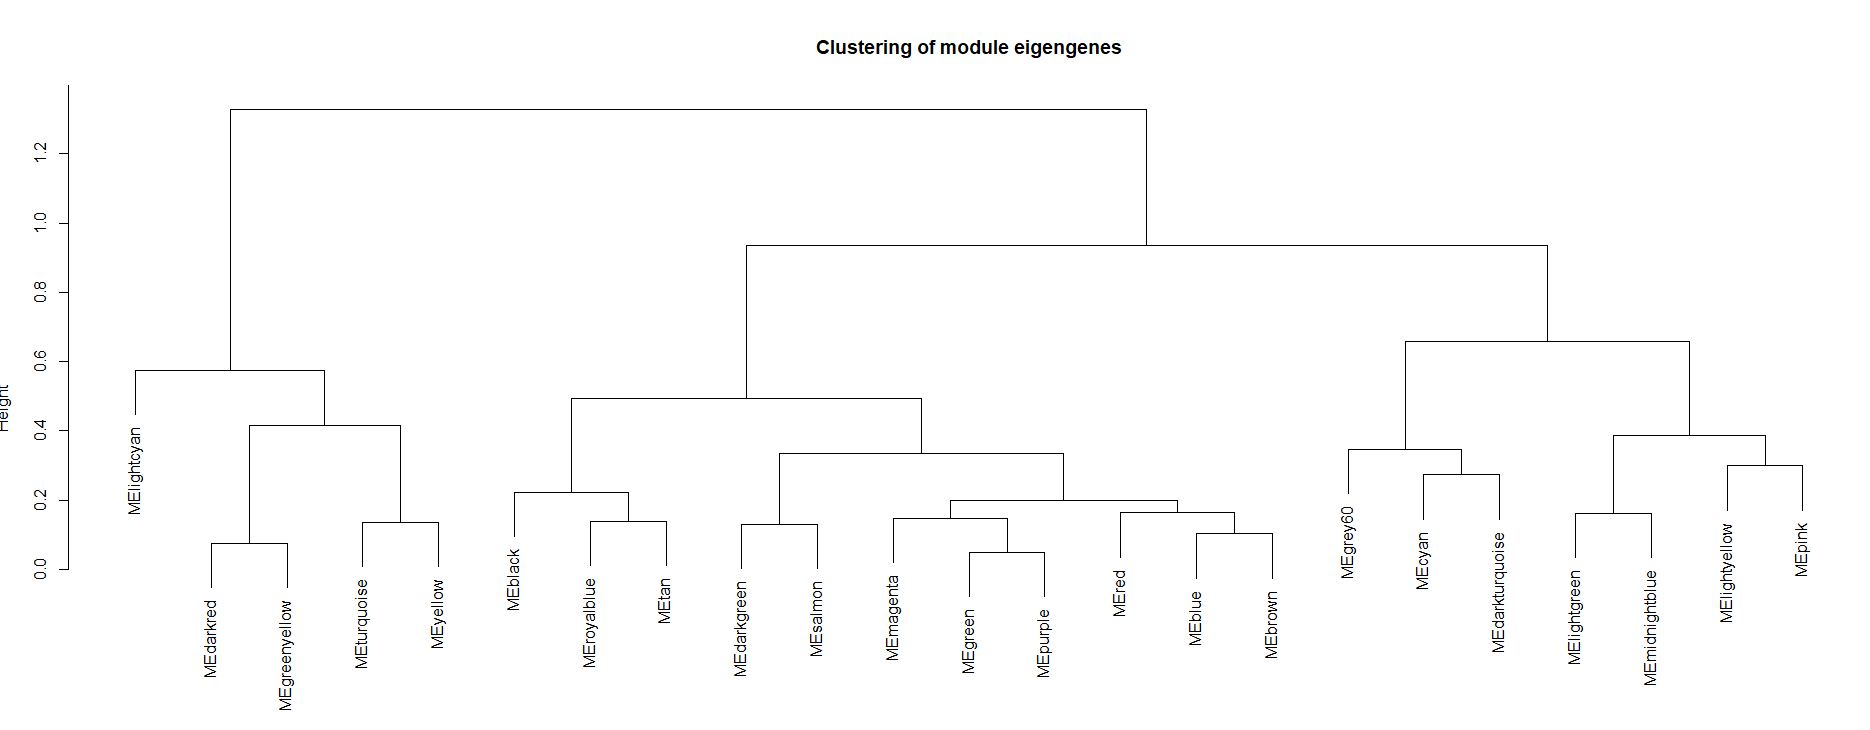
接下来,我们选择切割高度为0.25进行归类切割,将相似的模块划分为同一个模块。在这里,0.25的高度对应着相似度为0.75,0.1对应0.9的相似度,即如果你需要提高模块中的相似度的话,就将层次聚类的切割高度下降即可,这里我们选择0.25的切割高度。
MEDissThres = 0.25
# Plot the cut line into the dendrogram
abline(h=MEDissThres, col = "red")
# Call an automatic merging function
merge = mergeCloseModules(datExpr, dynamicColors, cutHeight = MEDissThres, verbose = 3)
# The merged module colors
mergedColors = merge$colors;
# Eigengenes of the new merged modules:
mergedMEs = merge$newMEs;
效果如下:
为了看我们合并前后模块的变化,我们再次可视化:
tiff(filename = "../result/14.tiff",width = 6, height = 4.5,units = 'in',res = 300)
plotDendroAndColors(geneTree,
                    cbind(dynamicColors, mergedColors),
                    c("Dynamic Tree Cut", "Merged dynamic"),
                    dendroLabels = FALSE,
                    hang = 0.03,
                    addGuide = TRUE,
                    guideHang = 0.05)
dev.off()
如下:
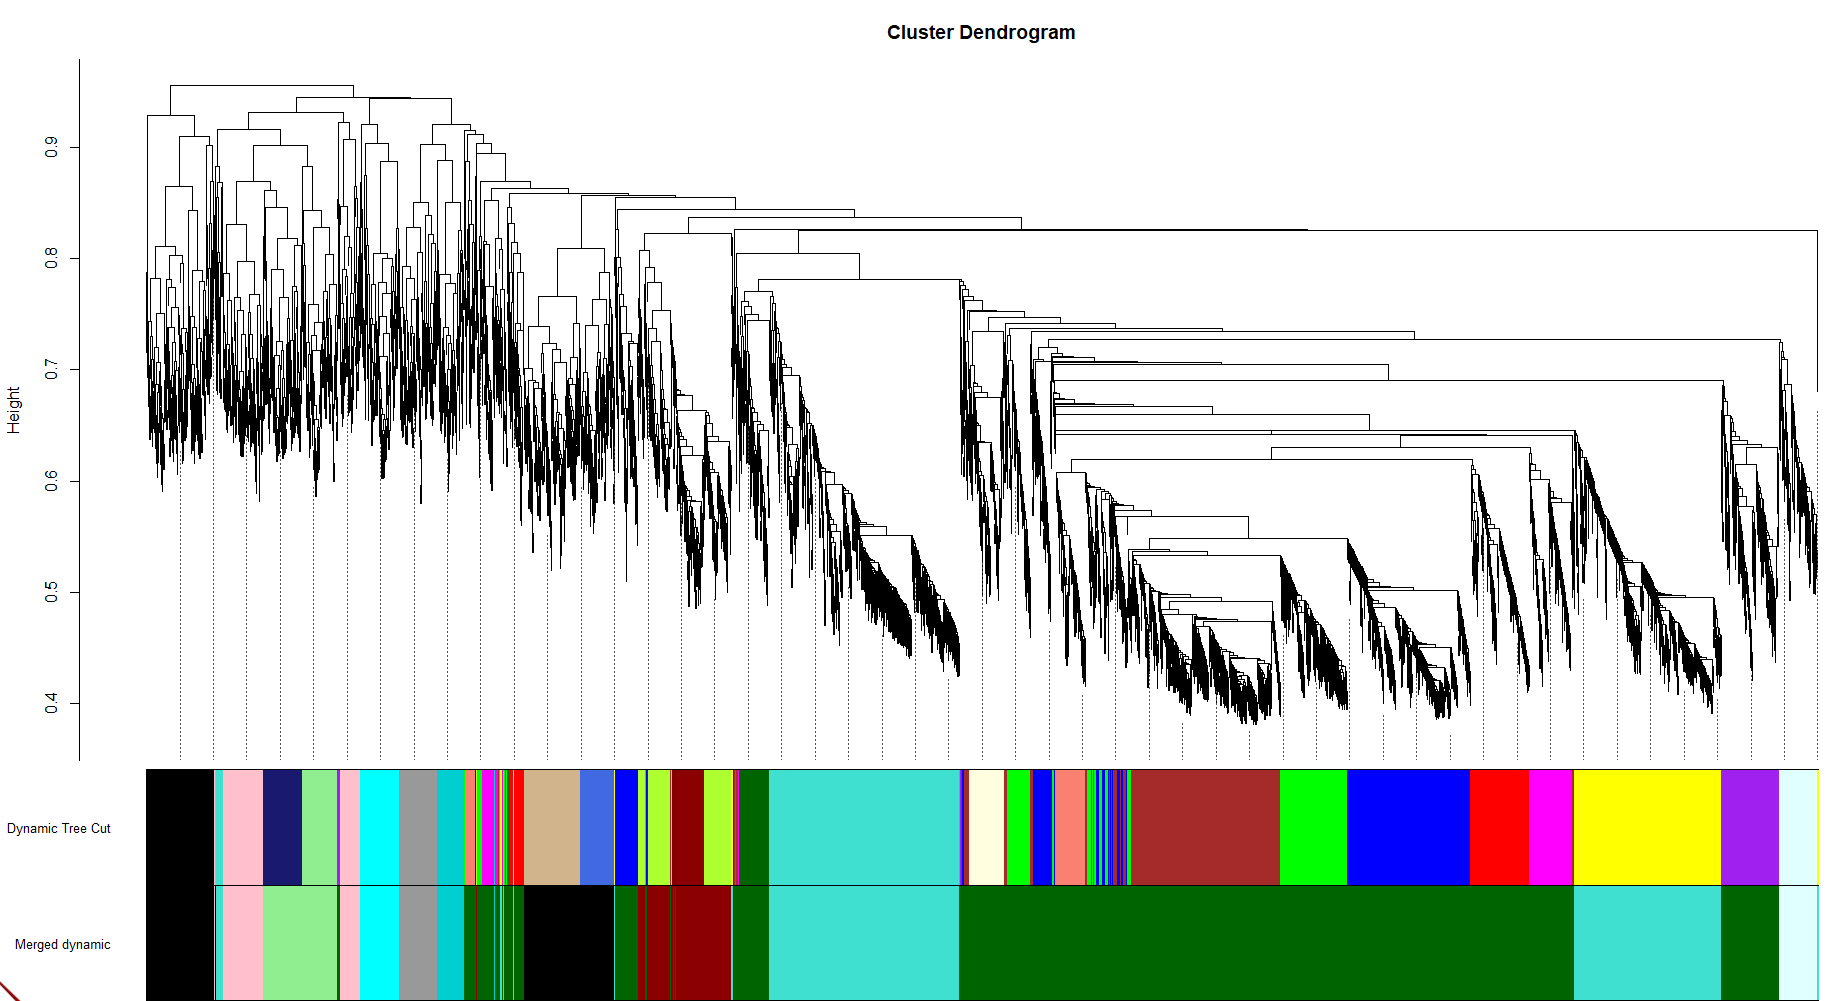
在随后的分析中,我们将在mergedColors中使用合并后的模块颜色。我们保存相关的变量,以便在本教程的后续部分使用。
# Rename to moduleColors
moduleColors = mergedColors

# Construct numerical labels corresponding to the colors
colorOrder = c("grey", standardColors(50));
moduleLabels = match(moduleColors, colorOrder)-1;
MEs = mergedMEs;

# Save module colors and labels for use in subsequent parts
save(MEs, moduleLabels, moduleColors, geneTree, file = "../result/15.Deodunum-02-networkConstruction-stepByStep.RData")
2.2.4 大型数据网络构建及模块识别-基于块状网络
这个部分,一般人基本用不着。这是专门为需要做大数据分析的人准备的,或者是计算机性能一般的人准备的。比如如果我的计算机性能只能一次性计算2000个基因,但我的数据却有10000个,也就是说需要5次才能计算完,那么我们需要将相应的参数调整,并且需要将这些基因拆分为5块。这就是简单的原理。
首先还是准备工作,不说话了,眼睛都说瞎了,看代码:
workingDir = ".";
setwd(workingDir);
library(WGCNA)
options(stringsAsFactors = FALSE);
enableWGCNAThreads() # 可用核心数
# load the data
lnames = load(file = "../result/1.Deodunum-01-dataInput.RData")
lnames
顺带给这两个代码,不想解释了
power = 8;
minModuleSize = 100;
bwnet = blockwiseModules(datExpr,
                       maxBlockSize = 20000,
                       power = power,
                       TOMType = "unsigned",
                       minModuleSize = minModuleSize,
                       reassignThreshold = 0,
                       mergeCutHeight = 0.25,
                       numericLabels = TRUE,
                       saveTOMs = TRUE,
                       saveTOMFileBase = "../result/8.QinchuanDeodumunTOM-blockwise",
                       verbose = 3)
# Load the results of single-block analysis
load(file = "FemaleLiver-02-networkConstruction-auto.RData");
# Relabel blockwise modules
bwLabels = matchLabels(bwnet$colors, moduleLabels);
# Convert labels to colors for plotting
bwModuleColors = labels2colors(bwLabels)
可视化:
tiff(filename = "../result/9.Gene dendrogram and module colors in block 1.tiff",width = 4, height = 2,units = 'in',res = 300,pointsize = 5)
plotDendroAndColors(bwnet$dendrograms[[1]],
                    bwModuleColors[bwnet$blockGenes[[1]]],
                    "Module colors",
                    main = "Gene dendrogram and module colors in block 1",
                    dendroLabels = FALSE,
                    hang = 0.03,
                    addGuide = TRUE,
                    guideHang = 0.05)
dev.off()
结果:
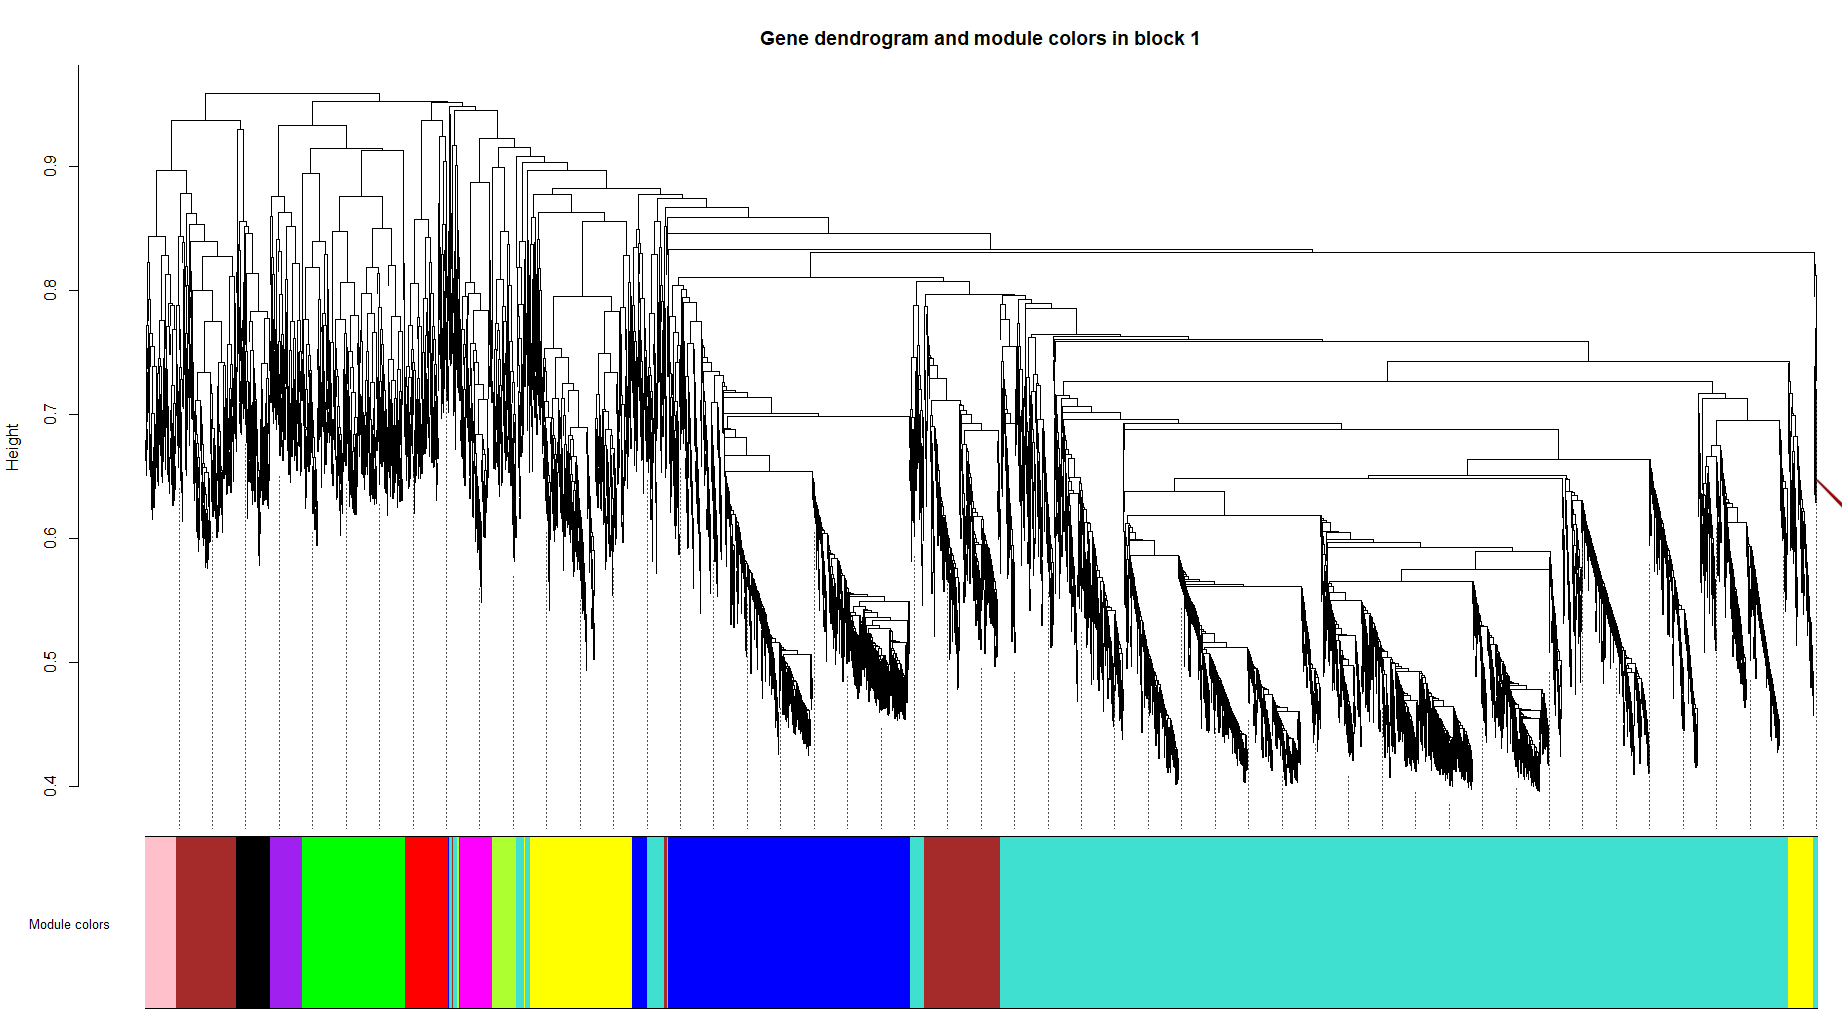
将这里的结果与前面2.2.2中的比较:
tiff(filename = "../result/10.Single block gene dendrogram and module colors.tiff",
     width = 4,
     height = 2,
     units = 'in',
     res = 300,
     pointsize = 5)
plotDendroAndColors(geneTree,
                    cbind(moduleColors, bwModuleColors),
                    c("Single block", "2 blocks"),
                    main = "Single block gene dendrogram and module colors",
                    dendroLabels = FALSE,
                    hang = 0.03,
                    addGuide = TRUE,
                    guideHang = 0.05)
dev.off()
结果:
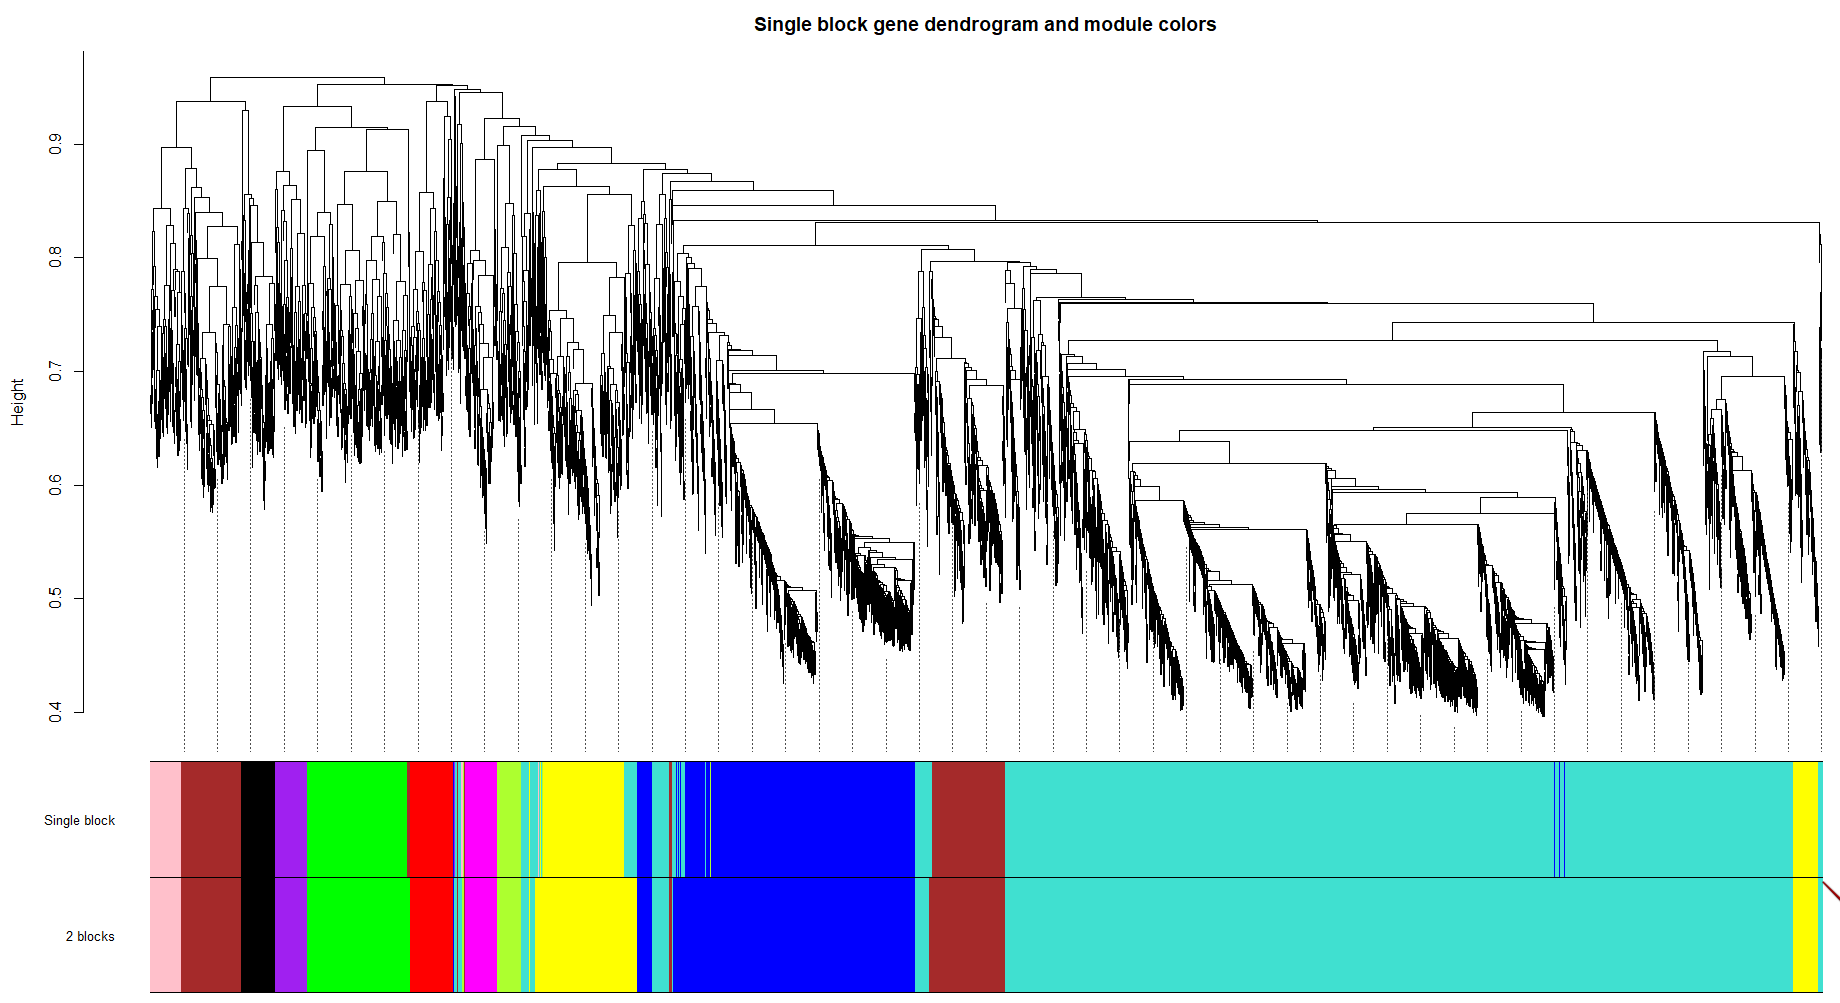
现在我们验证一下,在单块法和块法中相互对应的模块的eigengenes是极其相似的。我们首先根据单块和分块的模块颜色来计算模块eigengenes。
blockwiseMEs1 = match(names(singleBlockMEs), names(blockwiseMEs))
blockwiseMEs1
blockwiseMEs=blockwiseMEs[,c(1:8)] # 如果不一样需要将上面运行的数字往这里填一下,下同

singleBlockMEs1 = match(names(blockwiseMEs), names(singleBlockMEs))
singleBlockMEs1
singleBlockMEs = singleBlockMEs[,c(1,2,5,6,7,10,12,13)]

dim(blockwiseMEs)
dim(singleBlockMEs)

single2blockwise = match(names(singleBlockMEs), names(blockwiseMEs)) #
single2blockwise

signif(diag(cor(blockwiseMEs[,single2blockwise],singleBlockMEs)),3)
结果如下:

可以看出这些模块的相关性很强,并且都是正相关,惊不惊喜,意不意外?


