经过前面两个专栏的讲解,我们从数据的预处理,到数据模块构建,洋洋洒洒拆解了大概1万字左右的教程,在这个过程中,我自己也学到了不少的东西,感谢好友们的盛情让我学习到很多东西!今天争取把这个教程后面剩下的内容结了。
1. 模块与表型值的关联
老样子,先导入我们前面构建好的数据
rm(list = ls())
# Display the current working directory
getwd();
# If necessary, change the path below to the directory where the data files are stored.
# "." means current directory. On Windows use a forward slash / instead of the usual \.
workingDir = ".";
setwd(workingDir);
# Load the WGCNA package
library(WGCNA)
# The following setting is important, do not omit.
options(stringsAsFactors = FALSE);
# Load the expression and trait data saved in the first part
lnames = load(file = "../result/1.Deodunum-01-dataInput.RData");
#The variable lnames contains the names of loaded variables.
lnames
# Load network data saved in the second part.
lnames = load(file = "../result/6.QinchuanDeodunum-02-networkConstruction-auto.RData");
lnames
简单提一句,**.RData**是我们保存R数据的一种比较方便的方法,它不同于保存于csv、TXT、xlsx等格式文件,并且还可以同时保存多个数据,不懂可以翻看前两个专栏的教程,大概是下面这样的:
save(data1,.....,datn,file="filename.Rdata")1.1 量化模块与特征关联
该部分,我们想确定与所测量的表型性状有显著关联的模块,从而确定这个模块内高度相似共表达的基因参与什么生物学问题,并在这个模块内确定处于主导作用的基因。 由于我们已经构建了每个模块信息(eigengene),我们只需将eigengene与外部性状相关联,并寻找最显著的关联。
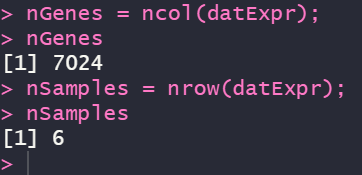
# Define numbers of genes and samples
nGenes = ncol(datExpr); # 输出参与计算的基因数量
nSamples = nrow(datExpr); # 输出参与计算的样本数量
# Recalculate MEs with color labels
MEs0 = moduleEigengenes(datExpr, moduleColors)$eigengenes
MEs = orderMEs(MEs0)
moduleTraitCor = cor(MEs, datTraits, use = "p");
moduleTraitPvalue = corPvalueStudent(moduleTraitCor, nSamples);
这里,截几个图,我就不用解释结果了:

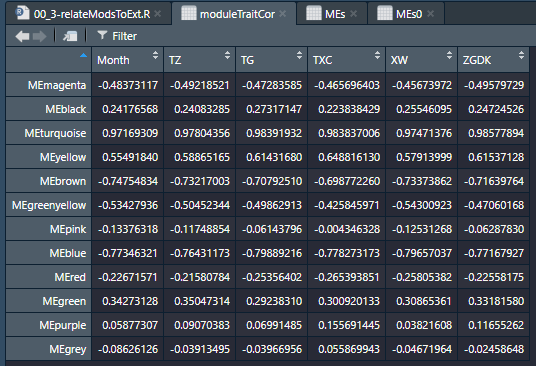
module和样本之间的关联(基于样本基因表达)

module和性状的关联
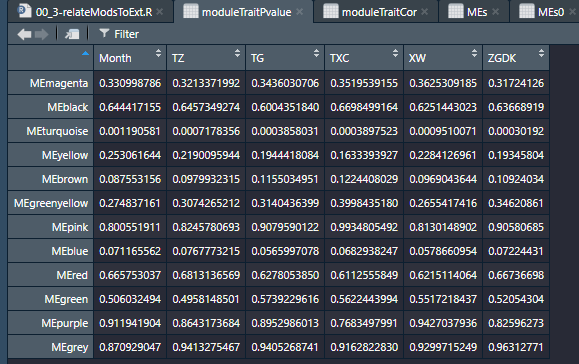
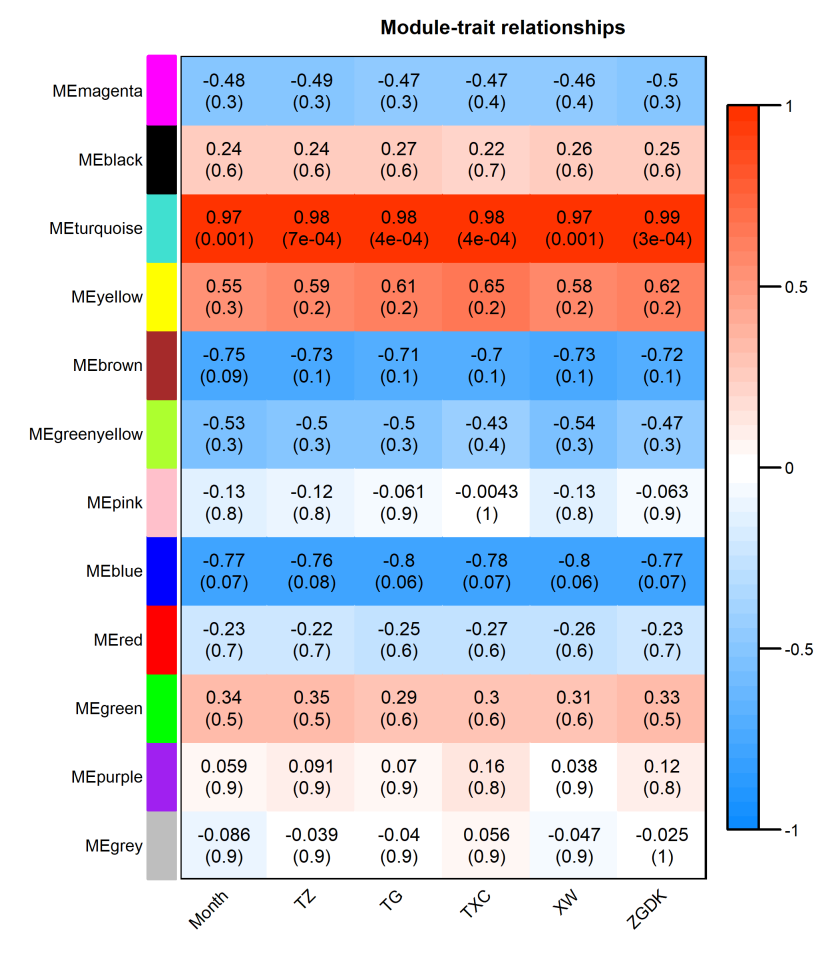
module与性状相关性显著性检验。在这里,我们可以看出month与turquoise模块之间的r=0.97(p=0.001),其他结果类似。一会儿咱们可视化后会更加清晰,其他的就不仔细看了。
话不多说,直接可视化:
sizeGrWindow(16,9)
# Will display correlations and their p-values
textMatrix =  paste(signif(moduleTraitCor, 2), "\n(",
                           signif(moduleTraitPvalue, 1), ")", sep = "");
# 将module与trait的相关性和显著性构建成一个字符串
dim(textMatrix) = dim(moduleTraitCor)
# Display the correlation values within a heatmap plot
tiff(filename = "../result/16.tiff",
     width = 8,
     height = 8,
     units = 'in',
     res = 600,
     pointsize = 5)
par(mar = c(4, 15, 3, 1));
labeledHeatmap(Matrix = moduleTraitCor,
               xLabels = names(datTraits),
               yLabels = names(MEs),
               ySymbols = names(MEs),
               colorLabels = FALSE,
               colors = blueWhiteRed(50),
               textMatrix = textMatrix,
               setStdMargins = FALSE,
               cex.text = 0.7,
               zlim = c(-1,1),
               main = paste("Module-trait relationships"))
dev.off()
?par
可视化结果如下:
1.2 基因与性状及重要模块间的关系:基因显著性和模块内基因关系
这句话翻译感觉有点鸟语,英语差的就看我的翻译,还行的就自己翻译去(Gene relationship to trait and important modules: Gene Significance and Module Membership)
这这里,我先给大家解释两个术语,基因显著性(Gene significance,GS)与成员之间相关性(module membership,MM)。
GS: associations of individual genes with our trait of interest (month) by defining Gene Significance GS as (the absolute value of) the correlation between the gene and the trait. 英语差的就看我的翻译,还行的就自己翻译去。即感兴趣性状与单个基因之间相关性的绝对值定义为GS,是否通俗明了?
MM: For each module, we also define a quantitative measure of module membership MM as the correlation of the module eigengene and the gene expression profile. 即基因表达与module主成分之间的相关性。
说了这么多,不如上代码来得快:
# Define variable weight containing the weight column of datTrait
InterestedModule = datTraits$Month # 选择自己感兴趣的表型,这里我们选择了Month
InterestedModule = as.data.frame(InterestedModule);
names(InterestedModule) = "InterestedModule"
# names (colors) of the modules
modNames = substring(names(MEs), 3) #返回MEs第三个字符往后的字符串

geneModuleMembership = as.data.frame(cor(datExpr, MEs, use = "p"));
MMPvalue = as.data.frame(corPvalueStudent(as.matrix(geneModuleMembership), nSamples));

names(geneModuleMembership) = paste("MM", modNames, sep="");
names(MMPvalue) = paste("p.MM", modNames, sep="");

geneTraitSignificance = as.data.frame(cor(datExpr, InterestedModule, use = "p"));
GSPvalue = as.data.frame(corPvalueStudent(as.matrix(geneTraitSignificance), nSamples));

names(geneTraitSignificance) = paste("GS.", names(InterestedModule), sep="");
names(GSPvalue) = paste("p.GS.", names(InterestedModule), sep="");
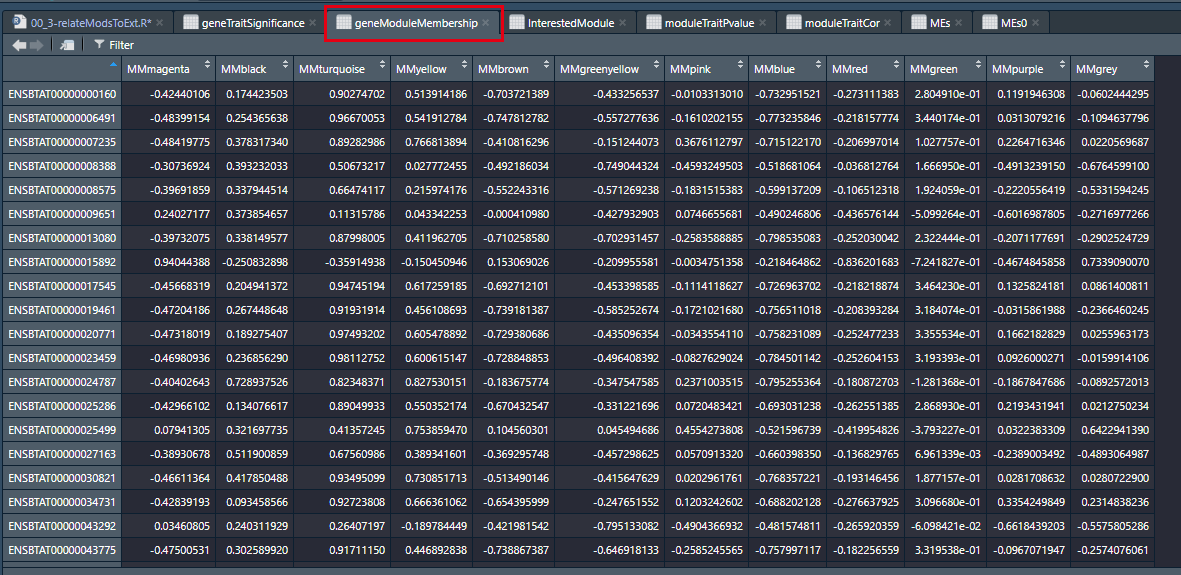
通过上述代码,我们构建出包含MM的数据框,如下:
1.3 模块内部进一步分析:依据高GS和MM挖掘重要基因
这里可以挖掘到一些重要的基因,具体后面说。这里我们看到这组数据里面,与Month呈正强相关的模块是tarquoise模块,那么我们直接对其进行可视化:
module = 'turquoise'
column = match(module, modNames);
moduleGenes = moduleColors==module;

sizeGrWindow(7, 7);
tiff(filename = "../result/Fig.4E(magenta).tiff",
     width = 6,
     height = 6,
     units = 'in',
     res = 600)
verboseScatterplot(abs(geneModuleMembership[moduleGenes, column]),
                   abs(geneTraitSignificance[moduleGenes, 1]),
                   xlab = paste("Module Membership in", module, "module"),
                   ylab = "Gene significance for body weight",
                   main = paste("Module membership vs. gene significance\n"),
                   cex.main = 1.2,
                   cex.lab = 1.2,
                   cex.axis = 1.2,
                   col = "magenta",
                   abline = TRUE,
                   lmFnc = lm)
garbage <- dev.off() # 这一行我记得当初总是报错,最后由dev.off()换成这样的代码就好了
结果如图:
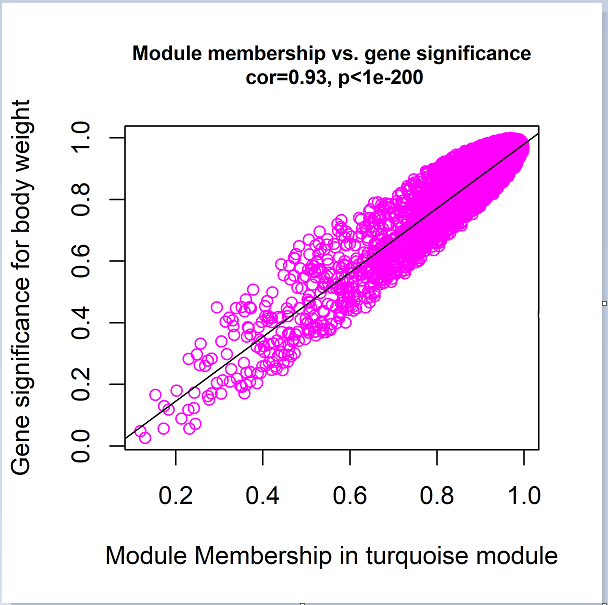
从图片我们可以看出,GS和MM是高度相关的,呈线性关系。
1.4 输出结果
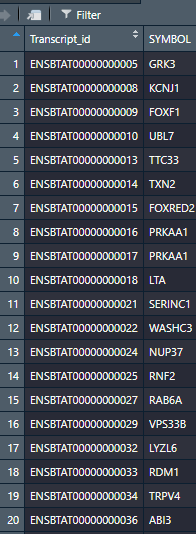
还记得我们数据准备的时候做了一个ID的转换吗,现在用的着了,直接读取。
y=read.xlsx("../data/final_expdat.xlsx")
names(y)
annot = y[,c(1,8)]
dim(annot)
names(annot)annot的数据如下:
然后进行整合并输出结果:
geneInfo0 = data.frame(gene_id = probes,
                      geneSymbol = annot$SYMBOL[probes2annot],
                      LocusLinkID = annot$SYMBOL[probes2annot],
                      moduleColor = moduleColors,
                      geneTraitSignificance,
                      GSPvalue)
# Order modules by their significance for RFI
modOrder = order(-abs(cor(MEs, InterestedModule, use = "p")));
# Add module membership information in the chosen order
for (mod in 1:ncol(geneModuleMembership))
{
  oldNames = names(geneInfo0)
  geneInfo0 = data.frame(geneInfo0, geneModuleMembership[, modOrder[mod]],
                         MMPvalue[, modOrder[mod]]);
  names(geneInfo0) = c(oldNames, paste("MM.", modNames[modOrder[mod]], sep=""),
                       paste("p.MM.", modNames[modOrder[mod]], sep=""))
}
# Order the genes in the geneInfo variable first by module color, then by geneTraitSignificance
geneOrder = order(geneInfo0$moduleColor, -abs(geneInfo0$GS.InterestedModule));
geneInfo = geneInfo0[geneOrder, ]

head(geneInfo)
上面图片第5第6列是我们感兴趣的模块,在上面1.2节中有指定是month。
然后我会自己习惯性的保存点其他东西:
write.xlsx(moduleTraitCor,file ="../result/17.moduleTraitCor.xlsx" )
write.xlsx(moduleTraitPvalue,file ="../result/17.moduleTraitPvalue.xlsx" )
2. 重要基因识别
直接上代码
library(openxlsx)
library(tidyverse)
rm(list = ls())
geneInfo=read.xlsx("result/17.geneInfo_Month.xlsx")
y=as.data.frame(table(geneInfo$moduleColor)) #统计每个模块中的基因数量
core_gene_pink=geneInfo %>%
  filter(abs(geneInfo$GS.InterestedModule)>=0.4 &
           abs(geneInfo$MM.red) >= 0.9 & moduleColor == "red")  %>%
  select(1:6,MM.red,p.MM.red) #筛选关键基因

head(core_gene_pink)
write.xlsx(core_gene_pink,file = "result/27.core_gene(month).xlsx")当然,还可以根据连接度来筛选关键基因,这里需要用到模块发构建拓扑结构时产生的Tom矩阵,具体怎么构建,见前述WGCNA分析专栏2-网络构建与模块识别代码如下:
lnames = load(file = "result/1.Deodunum-01-dataInput.RData");
#The variable lnames contains the names of loaded variables.
lnames
# Load network data saved in the second part.
lnames = load(file = "result/4.QinchuanDeodunumTOM-block.1.RData");
lnames

HubGenes <- as.data.frame(chooseTopHubInEachModule(datExpr,moduleColors))
colnames(HubGenes)[1]="Hubba"
HubGenes=data.frame(Module=as.character(rownames(HubGenes)),HubGenes=HubGenes$Hubba)
names(HubGenes)
annot=read.csv("../data/annot.csv")
names(annot)

HubGenes=merge(HubGenes,annot,by.x = 'HubGenes',by.y="ID")
write.xlsx(HubGenes,file = "../result/28.HubGenes_of_each_module.xlsx"
最后,画一张GS图
########终极版GS柱状图
rm(list = ls())
library(openxlsx)
library(tidyverse)
geneInfo = read.xlsx("result/17.geneInfo_SCC.xlsx")
##############
GeneSignificance=abs(geneInfo$GS.InterestedModule)
# Next module significance is defined as average gene significance.
tiff(filename = "result/GeneSignificance(SCC).tiff",
     width = 8,
     height = 4,
     units = 'in',
     res = 600)
par(mfrow = c(1,1))
plotModuleSignificance(GeneSignificance,
                       geneInfo$moduleColor,
                       main = "Gene significance across modules in SCC\n"
                       )
dev.off()
?plotModuleSignificance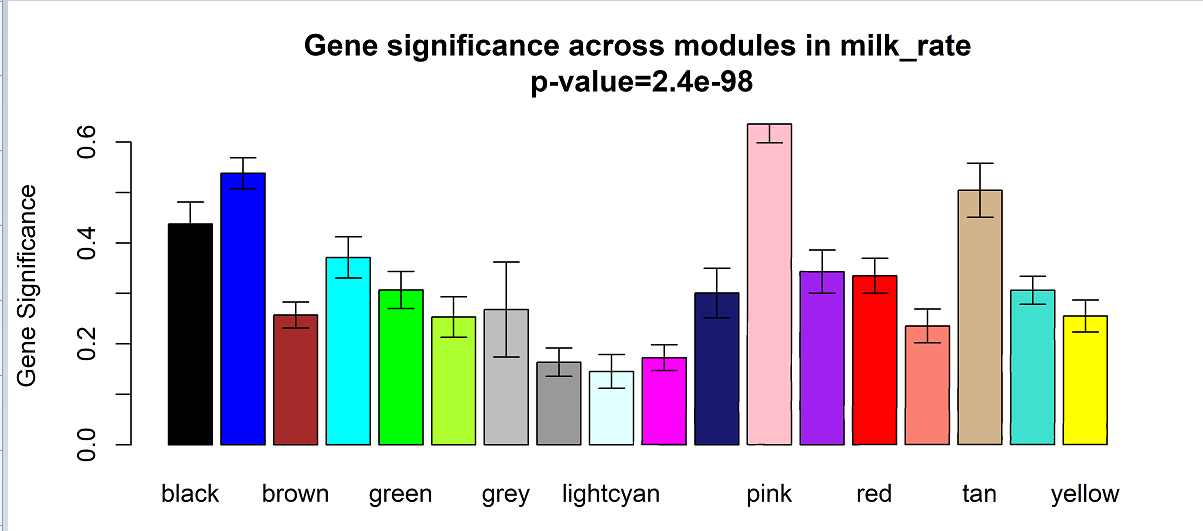
至此,WGCNA的分析的工作完成,进一步的分析就仁者见仁了。


