#~~~~~~~~~~~~~~~~~~~~~~~~~~~~~~~~~~~~~~~~~~~~~~~~~~~~~~~~~~~~~~~~~~~~~~~~~~~~~~~~~~~~~~~~~~~~~~~~~~~~#
#~~~~~~~~~~~~~~~~~~~~~~~~~~~~~~~~~~~~~~~~~~~~~~~~~~~~~~~~~~~~~~~~~~~~~~~~~~~~~~~~~~~~~~~~~~~~~~~~~~~~#
#~~~~~~~~~~~~~~~~~~~~~~~~~~~~~~~~~~~~~~~~~~~~~~~~~~~~~~~~~~~~~~~~~~~~~~~~~~~~~~~~~~~~~~~~~~~~~~~~~~~~#
#~~~~~~~~~~~~~~~~~~~~~~~~~~~~~~~~~~~~~~~~~ Steps_1_Correlation_Between_Samples~~~~~~~~~~~~~~~~~~~~~~~#
rm(list = ls())
workingDir = ".";
setwd(workingDir);
library(ggcorrplot)
library(openxlsx)
library(ComplexHeatmap)
library(ggplot2)
library(corrplot)
# loading data

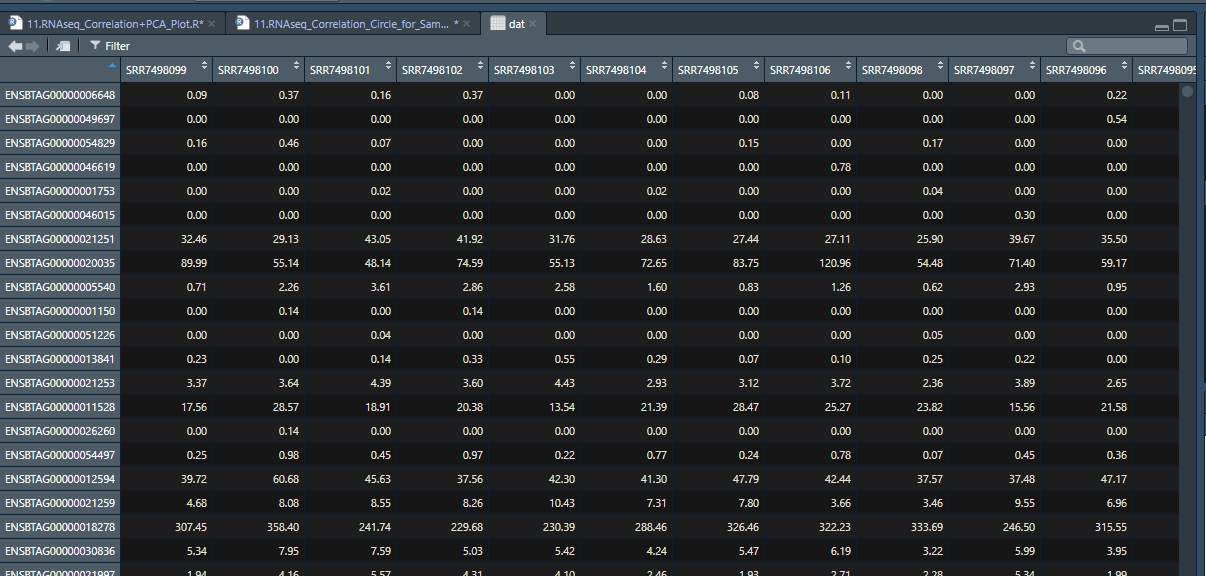
dat=read.csv("../Data/Angus.Rumen.Tpm.csv",row.names = 1)
head(dat,6)
names(dat)
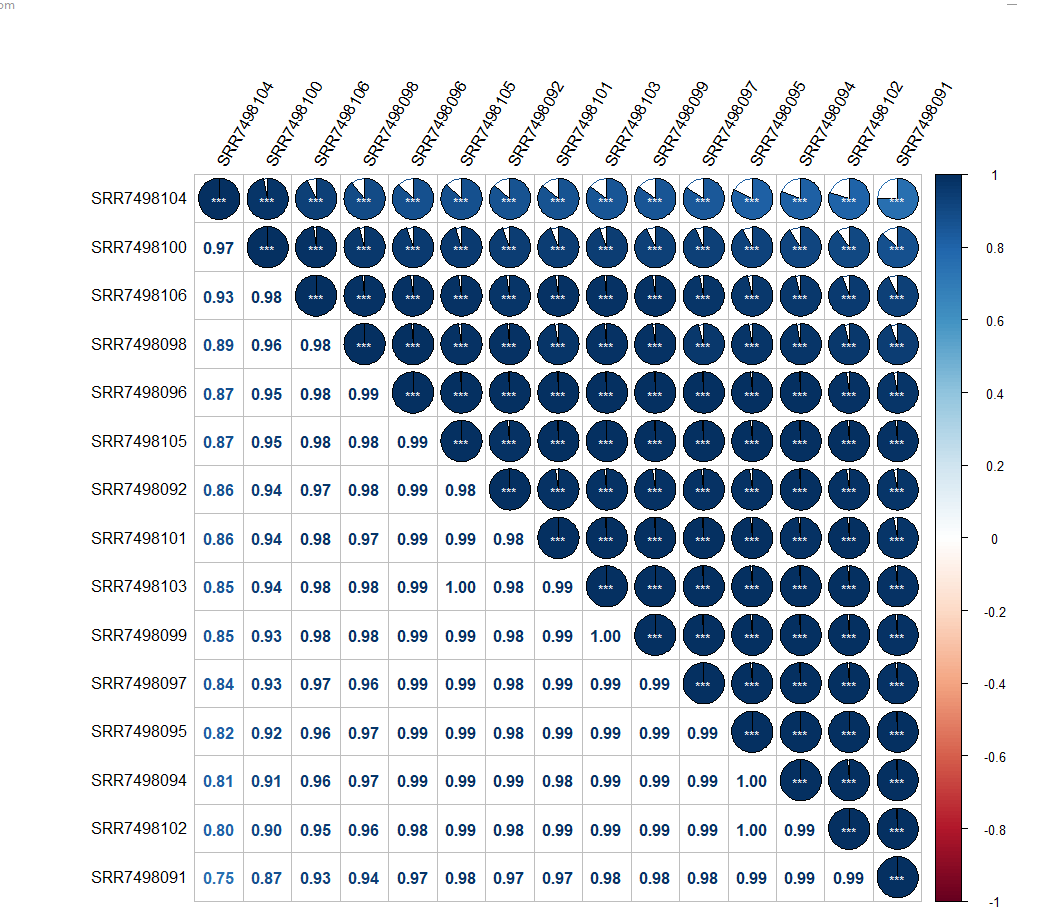
corr=round(cor(dat[,]),2) # Calculate the correlation coefficient

res1 <- cor.mtest(dat, conf.level = .95)
corrplot(corr, p.mat = res1$p, sig.level = .01)

## 设置不显著的空白
corrplot(corr, p.mat = res1$p, insig = "blank")

## 设置不显著的显示p值
corrplot(corr, p.mat = res1$p, insig = "p-value")

## 显示所有p值
corrplot(corr, p.mat = res1$p, insig = "p-value", sig.level = -1)

## 用 * 数量代表显示性
corrplot(corr, p.mat = res1$p, insig = "label_sig",
         sig.level = c(.001, .01, .05), pch.cex = .9,  pch.col = "black")
tiff(filename = "../Results/1.Rumen.cor.tiff",
     width = 3,
     height = 3,
     units = 'in',
     res = 600,
     pointsize = 5)
corrplot(corr,
         method = "pie",
         order = "AOE",
         hclust.method = "ward.D2",
         addrect = 4,
         rect.col = "blue",
         p.mat = res1$p, insig = "label_sig",
         sig.level = c(.001, .01, .05),
         pch.cex = .9,
         pch.col = "white",
         tl.col = "black",
         tl.cex = 1,tl.srt=60
         )
corrplot(corr,add=TRUE, type="lower",
         method="number",
         order="AOE",
         diag=FALSE,
         tl.pos="n",
         cl.pos="n")
dev.off()

#~~~~~~~~~~~~~~~~~~~~~~~~~~~~~~~~~~~~~~~~~~~~~~~~~~~~~~~~~~~~~~~~~~~~~~~~~~~~~~~~~~~~~~~~~~~~~~~~~~~~#
#~~~~~~~~~~~~~~~~~~~~~~~~~~~~~~~~~~~~~~~~~~~~~~~~~~~~~~~~~~~~~~~~~~~~~~~~~~~~~~~~~~~~~~~~~~~~~~~~~~~~#
#~~~~~~~~~~~~~~~~~~~~~~~~~~~~~~~~~~~~~~~~~~~~~~~~~~~~~~~~~~~~~~~~~~~~~~~~~~~~~~~~~~~~~~~~~~~~~~~~~~~~#
#~~~~~~~~~~~~~~~~~~~~~~~~~~~~~~~~~~~~~~~~~ Steps_1_PCA_Between_Samples~~~~~~~~~~~~~~~~~~~~~~~#


## PCA
library(gmodels)
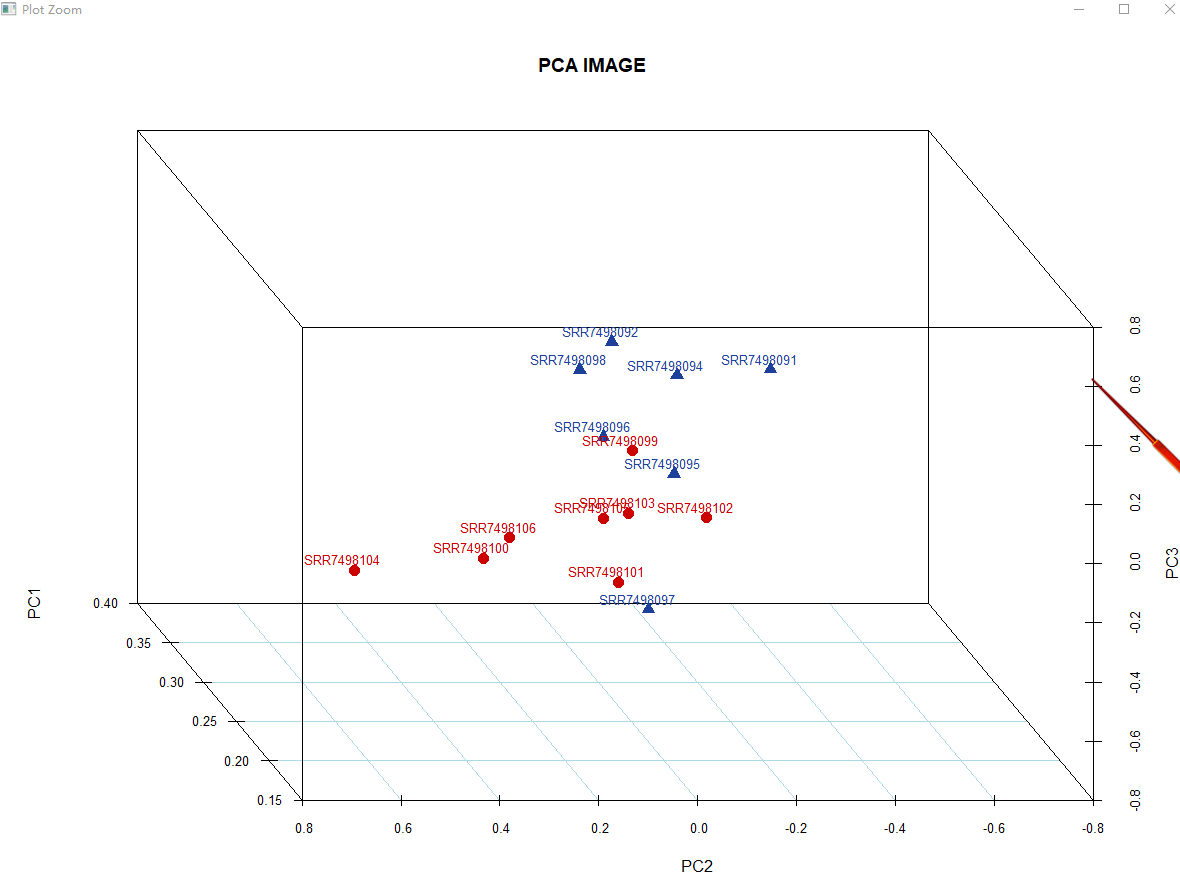
pca= fast.prcomp(dat[,])
pca$rotation
## plots
colnames(dat)
library(scatterplot3d)
pca_info= data.frame(sample = row.names(pca$rotation),
                     Type=c(rep('LRFI',8),rep('HRFI',7)),
                     pca$rotation)


# colors and shapes
colors = c(rep('#CC0000',8),rep('#1d419b',7))
shapes = c(rep(16,8),rep(17,7))

###############################################
getwd()
tiff(filename = "../Results/1.Rumen.3D.pca.tiff",
     width = 4,
     height = 3,
     units = 'in',
     res = 600,
     pointsize = 5)
s3d <- scatterplot3d(pca$rotation[,c(1:3)],
                     main='PCA IMAGE',
                     color=colors,
                     pch=shapes,
                     type='p',
                     highlight.3d=F,
                     angle=-60,
                     grid=T,
                     box=T,
                     scale.y=1,
                     cex.symbols=1.5,
                     col.grid='lightblue')
legend('bottom',legend = unique(pca_info$Type),
       col = unique(colors),
       pch = unique(shapes),
       inset = -0.25,
       xpd = TRUE,
       horiz = TRUE)
text(s3d$xyz.convert(pca_info[,c('PC1','PC2','PC3')]+0.01),
     labels = pca_info$sample,
     cex = 0.8,
     col = colors)
dev.off()
?pch
## plots from different angles
pca.plot <- function(ang){
        scatterplot3d(pca$rotation[,c(1:3)],
                      main='PCA IMAGE',
                      color=colors,
                      type='p',
                      highlight.3d=F,
                      angle=ang,
                      grid=T,
                      box=T,
                      scale.y=1,
                      cex.symbols=1.5,
                      pch=shapes,
                      col.grid='lightblue')
        legend('bottom',legend = unique(pca_info$Type),
               col = unique(colors),
               pch = unique(shapes),
               inset = -0.25,
               xpd = TRUE,
               horiz = TRUE)
        text(s3d$xyz.convert(pca_info[,c('PC1','PC2','PC3')]+0.01),
             labels = pca_info$sample,
             cex = 0.8,
             col = colors)
}
pdf("../Results//1.Rumen.PCA.pdf",height = 6,width = 6)
sapply(seq(-360,360,5),
       pca.plot)
dev.off()
数据格式:


